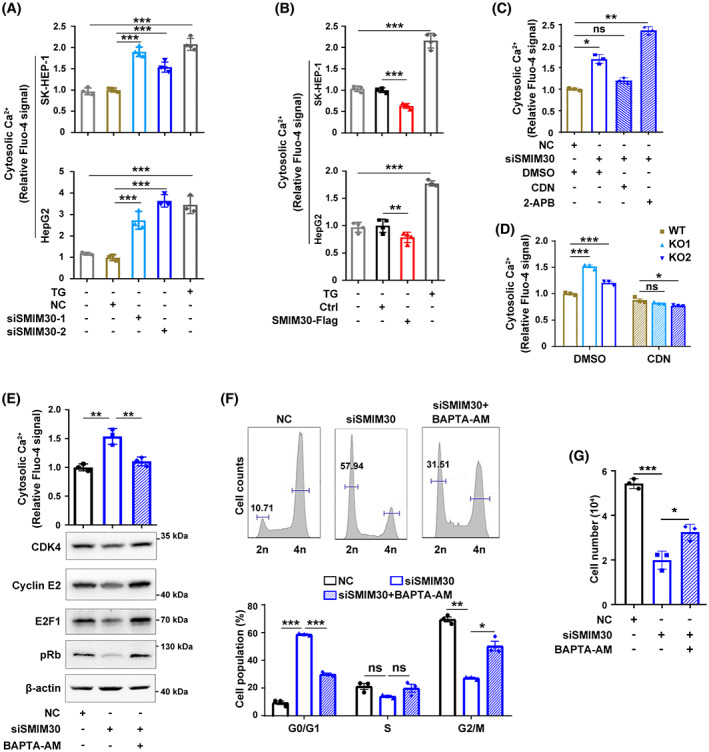
Fig. 6.

SMIM30 promotes the G1/S transition by regulating cytosolic calcium level. (A) Knockdown of SMIM30 increased the cytosolic calcium level. SK‐HEP‐1 or HepG2 cells were transfected with negative control (NC) or siSMIM30 for 48 h before detecting cytosolic calcium. siSMIM30‐1 and siSMIM30‐2, siRNAs targeting different regions of SMIM30 mRNA. (B) Overexpression of SMIM30 reduced the cytosolic calcium level. SK‐HEP‐1 or HepG2 cells stably expressing SMIM30‐Flag were cultured in a 24‐well plate for 48 h before detecting cytosolic calcium. Cells treated with 2 μm thapsigargin (TG, SERCA inhibitor) were used as a positive control. (C) SERCA agonist but not InsP3R inhibitor attenuated the effect of SMIM30 silencing in increasing cytosolic calcium level. siSMIM30 transfected SK‐HEP‐1 cells were treated with 10 μm CDN1163 (SERCA agonist) or 20 μm 2‐APB (InsP3R inhibitor) for 2 h before detecting cytosolic calcium. (D) ERCA agonist attenuated the effect of SMIM30 KO in increasing cytosolic calcium level. SMIM30 KO cells were treated with 10 μm CDN1163 for 2 h before detecting cytosolic calcium. Parental SK‐HEP‐1 cell line with WT SMIM30 was used as a control. (E) Treatment with calcium chelator abrogated the effect of siSMIM30 in reducing the levels of CDK4, cylinE2, E2F1 and pRb. NC‐ or siSMIM30‐transfectants were treated without or with 1 μm BAPTA‐AM (calcium chelator) for 36 h before cytosolic calcium detection or Western blotting (n = 2). (F) Exposure to calcium chelator abrogated the effect of siSMIM30 in repressing the G1/S transition. HepG2 cells were transfected with negative control (NC) or siSMIM30, followed by treatment without or with 1 μm BAPTA‐AM for 24 h before cell cycle analysis. (G) Treatment with calcium chelator ameliorated the role of siSMIM30 in inhibiting cell growth. NC‐ or siSMIM30‐transfectants were treated without or with 1 μm BAPTA‐AM for 3 days before counting cells. For (E–G), siSMIM30 represented a mixture of equal amount of siSMIM30‐1 and siSMIM30‐2. For A–G, data are represented as mean ± SEM of three independent repeats. P values were derived by one‐way (A–C, E, G) or two‐way (D, F) ANOVA. ns, not significant; *P < 0.05; **P < 0.01; ***P < 0.001.
