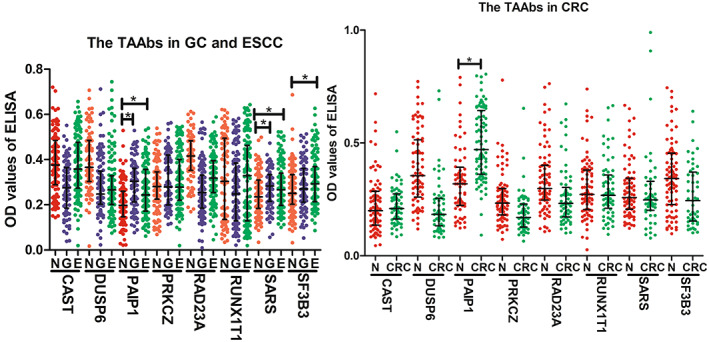
Fig. 4.

The scatter dot plot of the optical density (OD) values of ELISA for 8 TAAbs in the specific validation set. CRC, colorectal cancer; E, esophageal cancer; G, gastric cancer; N, normal controls. The line at the scatter plots was the median with interquartile range. *P < 0.05 by the Mann–Whitney U test. ELISA, enzyme‐linked immunosorbent assay; TAAb, autoantibody to tumor‐associated antigen.
