17.

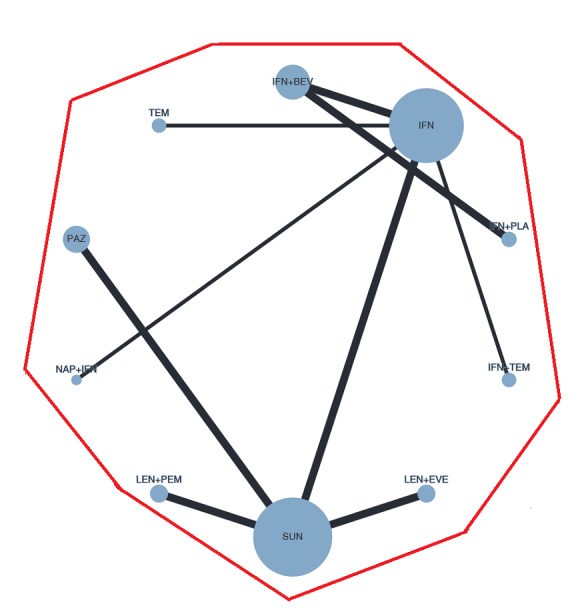
Network graph for OS (MSKCC intermediate and poor risk groups). Any two treatments are connected by a line when there is at least one trial comparing the two treatments. Line width: number of trials. Plot width: number of participants.

Network graph for OS (MSKCC intermediate and poor risk groups). Any two treatments are connected by a line when there is at least one trial comparing the two treatments. Line width: number of trials. Plot width: number of participants.