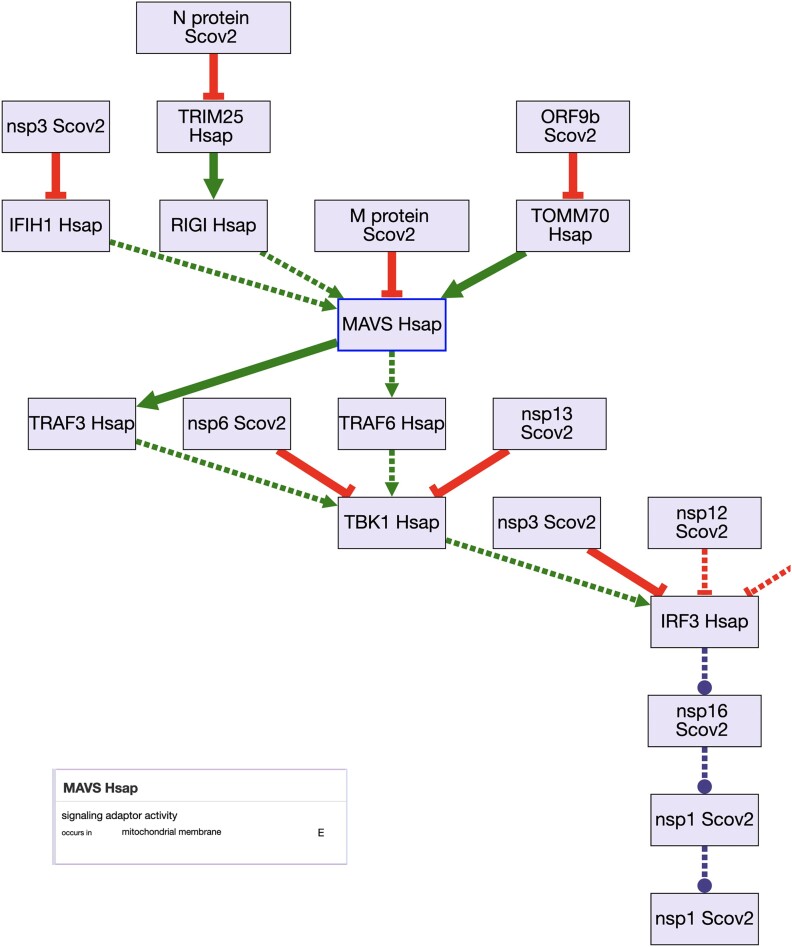
Fig. 2.
GO-CAM model of the SARS-CoV2—host interactions as displayed using the GO-CAM Pathway Widget (code available at https://github.com/geneontology/wc-gocam-viz) on the Alliance of Genome Resources gene pages (https://www.alliancegenome.org/gene/HGNC:20144#pathways). The model includes proteins from both humans (Hsap) and the SARS-CoV-2 virus (Scov2). A simplified representation of the causal model is shown on the main figure, which is simplified by labeling each activity with the gene and organism. The model includes many additional details, which are displayed as “cards;” the information for MAVS activity (inset) which normally acts as a signaling adaptor located in the mitochondrial membrane. MAVS activity is suppressed directly by the SARS-CoV-2M protein and indirectly by other SARS-CoV-2 proteins. Each of the “E” symbols on the right-hand side can be clicked to see the evidence for each assertion in the model.

