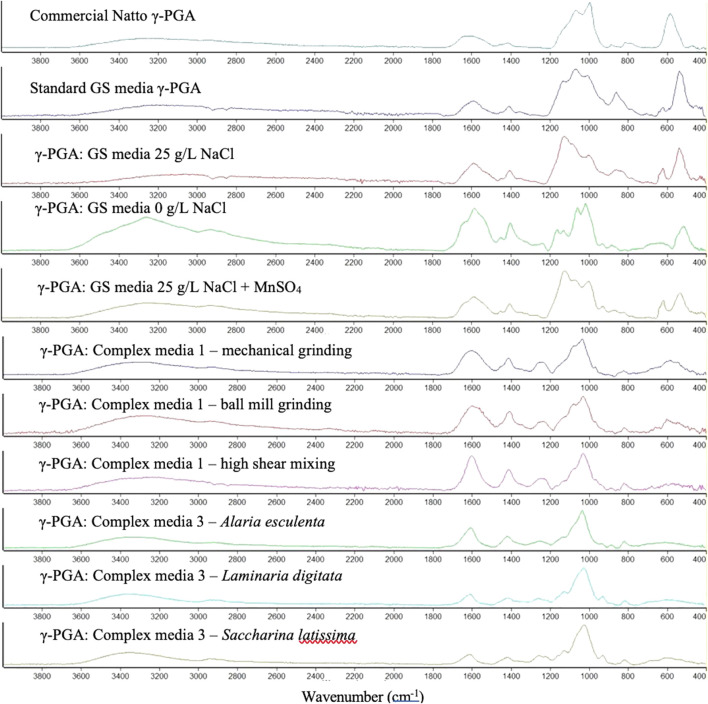
FIGURE 8.
Absorbance Fourier Transform Infra-Red spectra of γ-PGA obtained from different standard and complex waste substrates after tangential flow filtration. The peaks within the figure represent different functional groups of γ-PGA: C=O stretch (1739 cm−1), the Amide I N-H bend (1643 cm−1), the Amide II stretch (1585 cm−1), the C=O symmetric stretch of γ-PGA in its sodium (1402 cm−1) or calcium (1412 cm−1) isoform, the C-N stretch (1162 cm−1), the N-H bending (689 cm−1), the O-H stretch (3449 cm−1).

