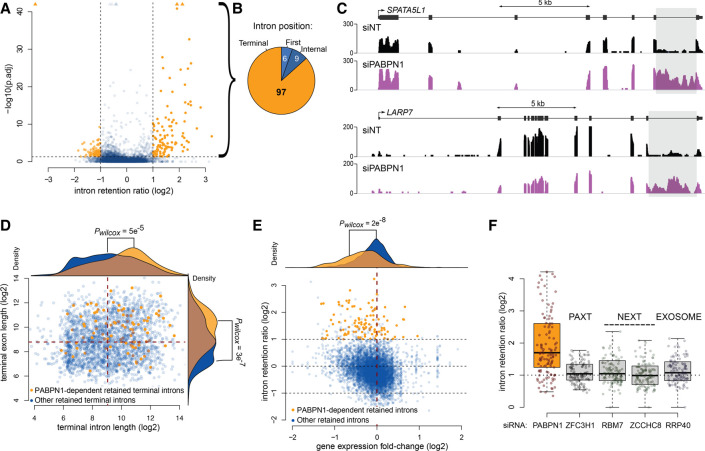
FIGURE 7.
Increased intron retention in PABPN1-deficient cells. (A) Volcano plot of the change in intron retention ratio (intron reads normalized on exon reads) in cells depleted for PABPN1 relative to control cells. Each point represents a detectable retained intron event (see Materials and Methods) in at least one condition (n = 6739). Intron significantly less or more retained in PABPN1-depleted cells relative to control with adjusted P-value (p.adj) < 0.05 and absolute log2 intron retention ratio >1 are colored in orange. Data points with p.adj coordinates that fall outside of the axes range are represented as triangles. (B) Position within their parent transcript of the 112 introns that are significantly more retained in cells depleted for PABPN1. (C) Read coverage over the SPATA5L1 and LARP7 genes. The gray area highlights their respective last intron, which are more retained in cells depleted for PABPN1 (purple) compared to control cells (black). (D) Log2 nucleotide length for all detectable retained terminal introns in at least one condition against the length of their following terminal exon (n = 2414). The points representing the 97 terminal introns significantly more retained in cells depleted for PABPN1 are colored in orange whereas retained terminal introns insensitive to PABPN1 are colored in blue. The density distribution of the log2 nucleotide length is drawn on top of the panel for the intron and on the right of the panel for the corresponding following exons. (E) Log2 fold change in intron retention against the log2 fold change of gene expression in cells depleted for PABPN1 relative to control (n = 6739 introns from 2721 different genes). The 112 introns significantly more retained in cells depleted for PABPN1 and their 101 associated genes are represented by orange points whereas retained introns not significantly affected by PABPN1 are colored in blue. The density distribution of the log2 fold change of gene expression is drawn on top of the panel in orange for those 101 genes or in blue for the other genes. (F) Boxplot of the change in intron retention ratio in cells depleted for PABPN1, the PAXT component ZFC3H1, the NEXT components RBM7 and ZCCHC8, and the exosome component RRP40 (Meola et al. 2016) for the 97 terminal introns identified as more retained in PABPN1-depleted cells in our own study. The distribution of the fold change is significantly shifted from 1 in PABPN1-depleted cells (pWilcoxon = 2 × 10⁻¹³).

