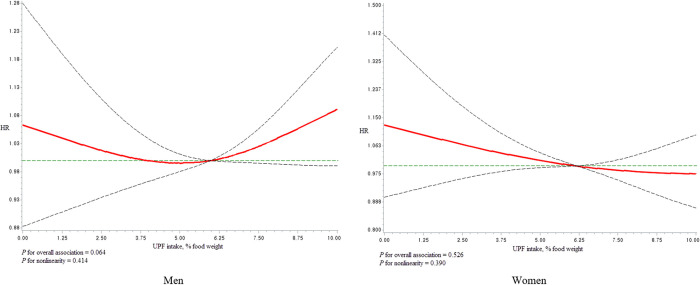
Fig 3. Dose-response association of UPF intake and all-cause mortality in men and women using regression splines with three knots at the 5th, 50th and 95th percentiles of the UPF distribution.
The red line indicate hazard ratios (HR) and the dotted lines indicate the 95% CI. The reference value for HRs was 5.6 (median of % food weight from UPF). The model was adjusted for age, total energy intake, education level, monthly income, marital status, smoking, drinking, regular physical exercise, comorbidity score, menopausal status, and use of oral contraceptives.

