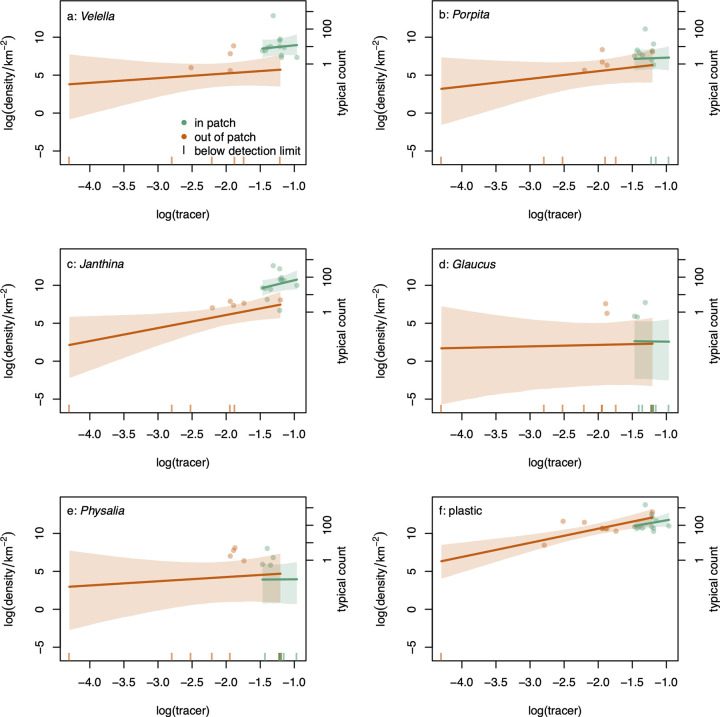
Fig 3.
Relationship between natural log of density (in numbers km−2) and natural log of dimensionless tracer concentration for (a) Velella, (b) Porpita, (c) Janthina, (d) Glaucus, (e) Physalia, and (f) plastic outside (orange) and in (green) the patch. Points are sample means from 2 independent counts, with zeros plotted as vertical lines on the x-axis (note that models were fitted to the 2 counts, not the mean densities). Lines are posterior means, with 95% equal-tailed credible bands, and include the detectability parameters. The right-hand y-axis has tick marks at the log densities corresponding to counts of 1, 10, 100, and 1,000 objects in the mean trawled area. The data underlying this figure can be found in S1 Data.

