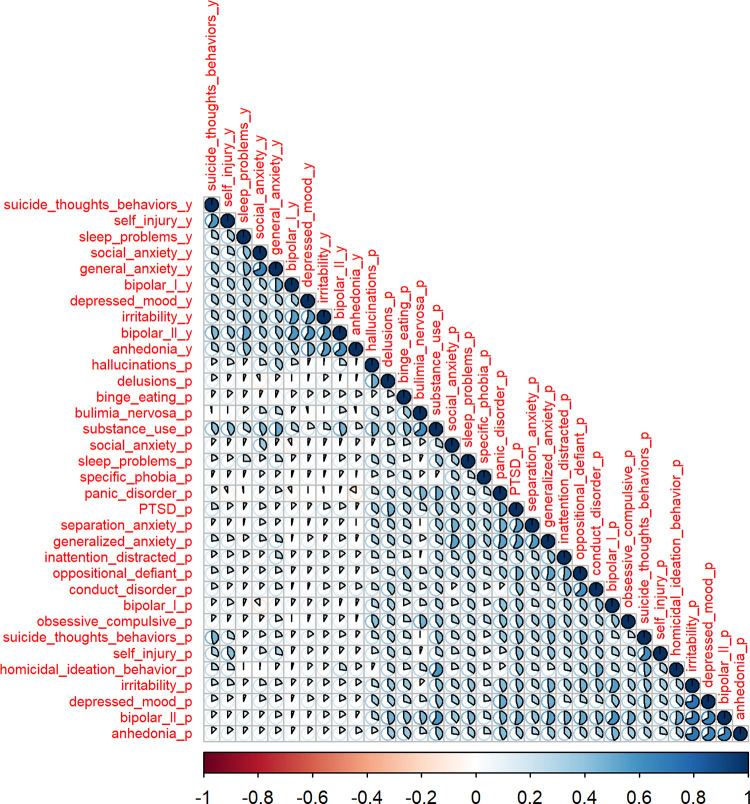
Fig 1. Correlation matrix for 34 psychiatric symptoms and diagnoses based on youth and parent reports at baseline.
Tetrachoric correlation values are represented by the shaded proportion of the pie-charts in each cell of the correlation matrix as well as by the intensity of the shading on a divergent red and blue color-scale. Measures based on youths’ self-reports end in the suffix “_y” while measures based on parent reports of their child end with the suffix “_p”. Variables are ordered by hierarchical clustering.

