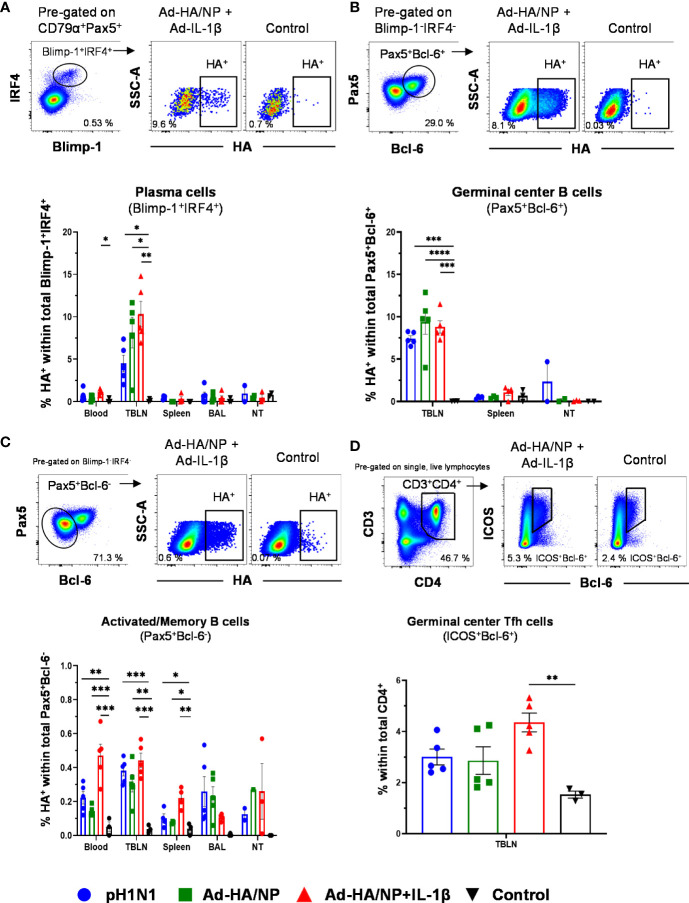
Figure 2.
Frequencies of HA-specific plasma cells, germinal center B cells, and activated/memory B cells. B cell subsets were gated as described in Supplementary Figure 1 . (A) Plasma cells, (B) GC B cells, and (C) activated/memory B cells and HA-binding cells were identified within these subsets. Representative raw data is shown for an Ad-HA/NP + Ad-IL-1β treated pig versus a control pig. Graphs below show percentages of HA-binding cells within the respective subset across tissues and treatment groups. (D) CD3+CD4+ICOS+Bcl-6+ Tfh cells were identified according to the gating on the top. Each symbol represents data from an individual pig of the different treatment groups. Asterisks indicate significant differences between treatment groups within one location (*, p<0.05; **, p<0.01; ***, p<0.001 and ****p<0.0001).

