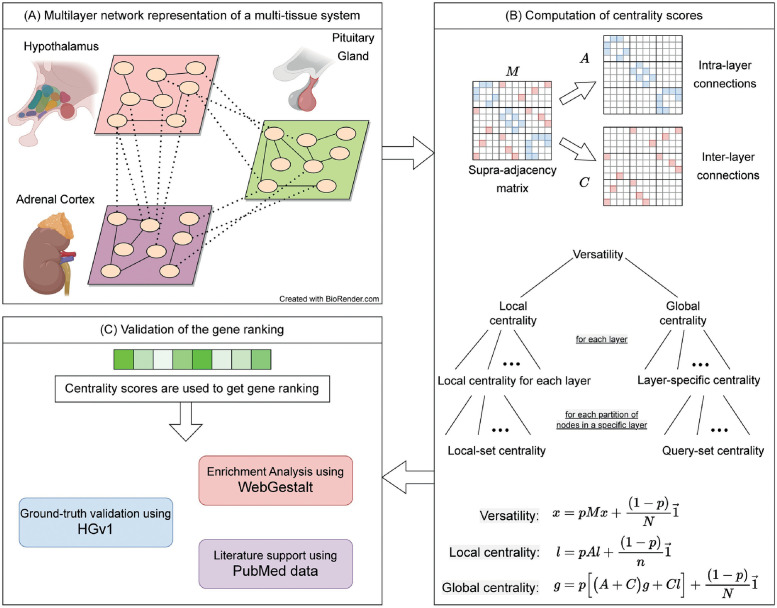
Fig 1. Workflow of our MultiCens measures.
(A) Each layer in the network represents a tissue, and connections represent gene-gene interactions (e.g., inferred from transcriptomic data). (Created with BioRender.com) (B) Supra-adjacency matrix (M) contains within-tissue connections on the diagonal blocks (intra-layer matrix A), and across-tissue connections on the off-diagonal blocks (inter-layer matrix C). The A, C matrices are used to compute different hierarchically-organized centralities as shown (note: the “collectively exhaustive node-sets” mentioned actually partition all the nodes in a layer or the network; see text). The centrality vectors (x, l, and g) have an entry for each gene in every tissue. (C) The centrality scores are used to obtain gene rankings which are further validated using different methods, and interpreted to predict novel mediators of inter-tissue signaling.

