. 2023 Mar 28;145(7):071006. doi: 10.1115/1.4056871

Fig. 4.

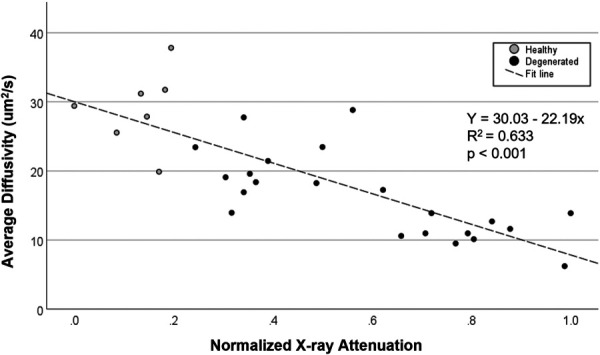
Correlation between average diffusivity and CEP calcification level, as assessed by the normalized average CEP X-ray attenuation. Gray dots and black dots indicate the cartilage endplates from healthy (n = 7) and degenerated (n = 22) groups, respectively.

Correlation between average diffusivity and CEP calcification level, as assessed by the normalized average CEP X-ray attenuation. Gray dots and black dots indicate the cartilage endplates from healthy (n = 7) and degenerated (n = 22) groups, respectively.