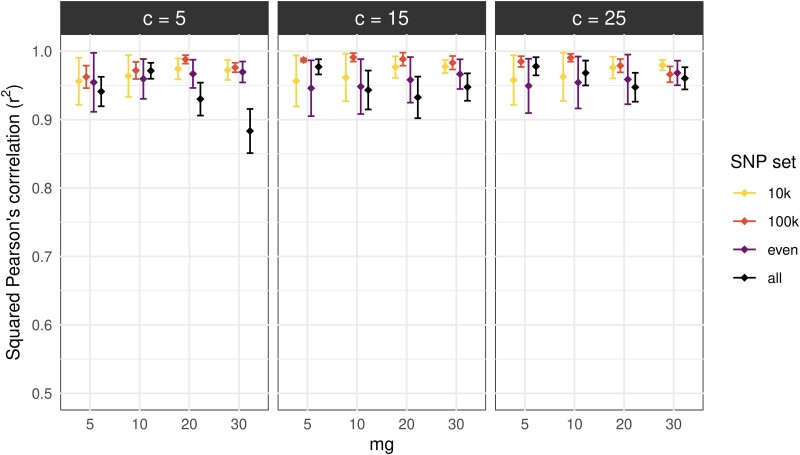
Fig. 1.
ELAI accuracy in inferring local ancestry in simulated hybrids. The plot shows correlations between the true local ancestry dosage and ELAI dosages with different parameter numbers: number of lower clusters (c = 5, 15, and 25), number of admixture generations (mg = 5, 10, 20, and 30), and different SNP sets (10 K SNPs, 100 K SNPs, evenly distributed SNPs—1 SNP/5 kb, and all SNPs—1 M SNPs). Each point represents an average of correlations computed for the three simulated hybrids, and error bars represent the standard deviation.

