. 2023 Apr 21;12:e80365. doi: 10.7554/eLife.80365

Figure 2. Bone strength, bone microstructure, and bone formation activity of PLS3E10-16del/0 rats.

(A) Mechanical three-point bending tests of femora from PLS3E10-16del/0 and WT rats (n=5-8 per group). (B) Typical load-displacement curves of PLS3E10-16del/0 and WT rats. (C) Indentation tests of L5 from PLS3E10-16del/0 and WT rats (n=5 per group). Data were analyzed using unpaired two-tailed Student t test. *p<0.05, **p <0.01, ***p <0.001 vs WT groups. (D) Three-dimensional reconstruction images of femurs from PLS3E10-16del/0 and WT rats. (E) Micro-CT assessment of the distal femurs from PLS3E10-16del/0 and WT rats (n=5-8 per group). BV/TV: bone volume/tissue volume, Ct.Th: cortical thickness, Tb.Th: trabecular thickness, Tb.N: trabecular number. (F) Representative von Kossa-stained sections of tibia diaphysis of PLS3E10-16del/0 and WT rats. Scale bar = 2000 μm. WT: wild-type. (G) Typical images of unstained and uncalcified vertebra of PLS3E10-16del/0 rats and comparison of mineral apposition rate (n=4 per group). Scale bar = 10 μm. Data were analyzed using unpaired two-tailed Student t test. *p<0.05 vs WT groups. Tb.MAR: mineral apposition rate of lumbar trabeculae. (H) Expression level of COL1A1 and photomicrographs of picrosirius red-stained sections of cortical bone regions of femur visualized through polarized light microscopy. Scale bar = 100 μm. Data were pooled from three independent experiments and were presented as mean ± SEM.

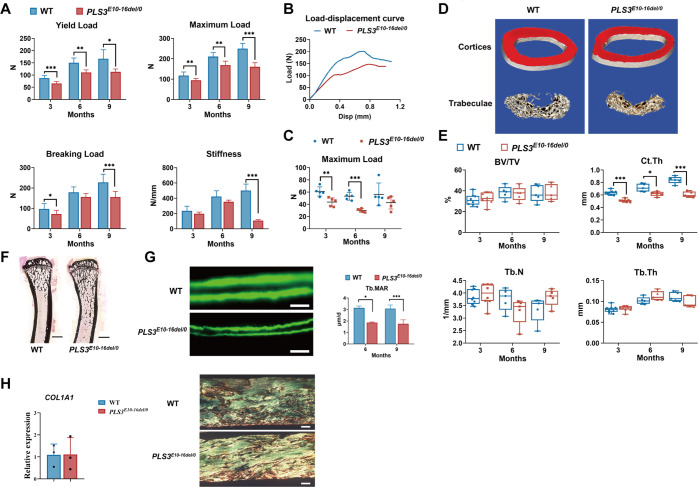
Figure 2—source data 1. Original data of the results of three-point binding tests.
Figure 2—source data 2. Original data of the results of indentation testing.
Figure 2—source data 3. Micro-computed tomography (μCT) analysis of the distal femur and histomorphometric evaluation of L4.
Figure 2—source data 4. Original data of histomorphometry.

Figure 2.

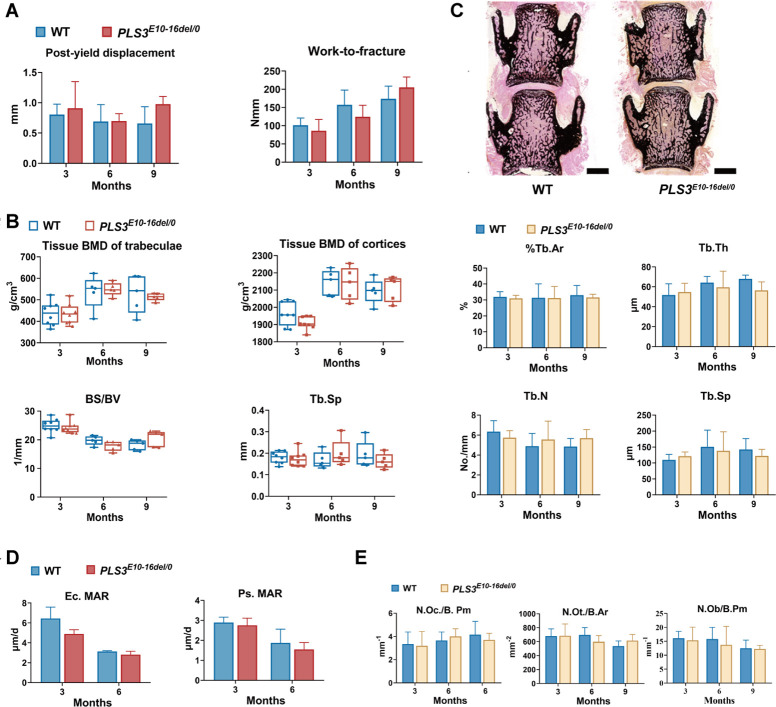
Figure 2—figure supplement 1. Bone strength and bone morphometry parameters of PLS3E10-16del/0 rats.

Figure 2—figure supplement 1.

(A) Mechanical three-point bending tests of femora from PLS3E10-16del/0 and WT rats (n=5-8 per group). WT: wild-type. (B) Micro-CT assessment of the distal femur from PLS3E10-16del/0 and WT rats. BS/BV: bone surface/bone volume, Tb.Sp: trabecular separation. (C) Histomorphometric evaluation of L4 from PLS3E10-16del/0 and WT rats (n=5-7 per group). %Tb.Ar: trabecular area, Tb.Th: trabecular thickness, Tb.N: trabecular number, Tb.Sp: trabecular separation. Scale bar = 2000 μm. (D) Analysis of mineral apposition rate (MAR) in tibial cortices of PLS3E10-16del/0 rats (n=4-5 per group). Ec.MAR: mineral apposition rate of endocortical surface of tibia cortex. Ps.MAR: mineral apposition rate of periosteal surface of tibia cortex. (E) Measurements of osteoclasts, osteocytes, and osteoblasts of PLS3E10-16del/0 rats (n=5-8 per group). N.Oc./B.Pm: osteoclast number per bone perimeter, N.Ot./B.Ar: osteocyte number per bone area; N.Ob/B.Pm: osteoblast number/bone perimeter.
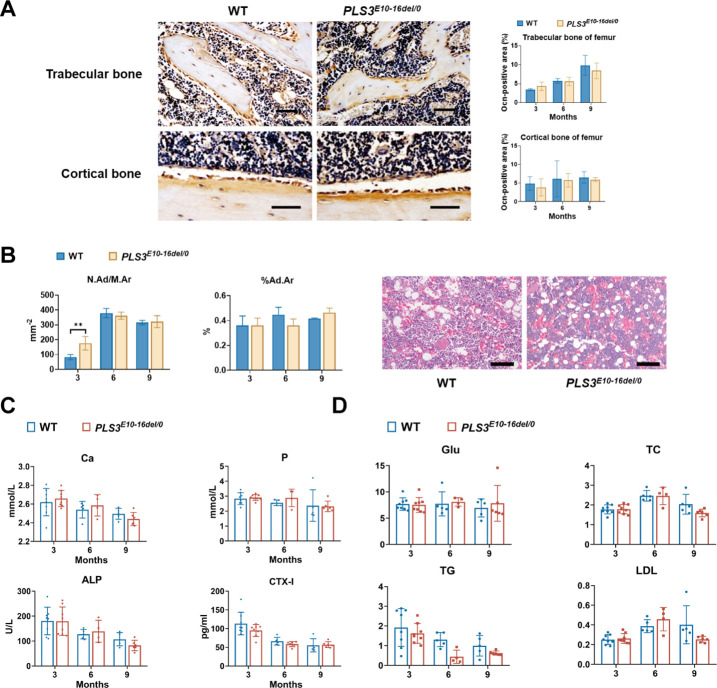
Figure 2—figure supplement 2. Histological, immunohistochemical, and serum biochemical analysis of PLS3E10-16del/0 rats.

Figure 2—figure supplement 2.

(A) Representative images of osteocalcin (Ocn) immunohistochemistry in the femur bone sections and its quantification data (n=3-5 per group). Scale bar: 100 μm. (B) Measurements of adipocytes of PLS3E10-16del/0 rats (n=3-5 per group). N.Ad/Mr: number of adipocytes in the distal marrow per tissue area. %Ad.Ar: area of adipocytes in the distal marrow per tissue area. Scale bar: 100 μm.Data were analyzed using unpaired two-tailed Student t test. **p<0.01 vs WT groups. (C) Serum levels of bone metabolic markers in Pls3E10-16del/0 and wild-type (WT) rats (n=5-8 per group). Ca: calcium, P: phosphorus, β-CTX: β-C-telopeptide of type Ⅰ collagen, bone resorption marker, ALP: alkaline phosphatase. ELISAs were used to determine the levels of CTX-I. An automated chemistry analyzer was used to measure the levels of the Ca, P, and ALP. (D) Parameters of glucose and lipid metabolism in PLS3E10-16del/0 rats (n=5-8 per group). Glu: glucose, TC: total cholesterol, LDL: low-density lipoprotein, TG: total glycerides. All parameters were measured by an automated chemistry analyzer.