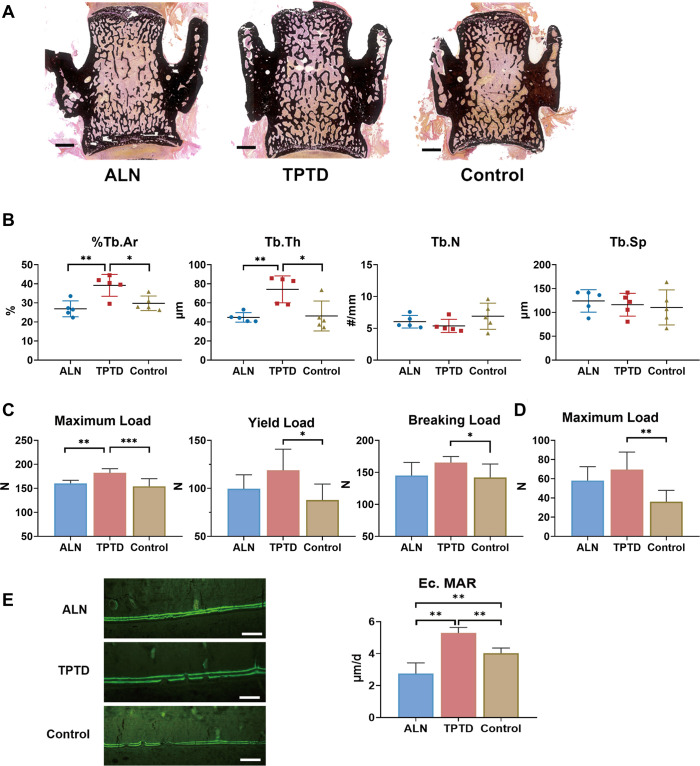
Figure 4. Changes in microarchitecture and strength after anti-osteoporotic treatment.
(A) Typical images of unstained and uncalcified vertebra of PLS3E10-16del/0 rats after treatment. Scale bar = 1000 μm. (B) Histomorphometric analysis of L4 after treatment (n=5 per group). %Tb.Ar: trabecular area, Tb.Th: trabecular thickness, Tb.N: trabecular number, Tb.Sp: trabecular separation. (C) Effects of treatment on the mechanical strength of femoral diaphysis (n=8 per group). The diaphysis was subjected to three-point bending test to failure, which provided data on yield load, maximum load, breaking load. (D) Effects of treatment on the mechanical strength of L5 (n=7-8 per group). The vertebral body was subjected to indentation test to acquire maximum load. (E) Comparison of Ec.MAR in the tibial cortex among three treatment groups (n=5 per group). Scale bar = 100 μm. ALN: alendronate, TPTD: teriparatide, control: saline. Ec.MAR: mineral apposition rate of endocortical surface of tibia cortex. Data were shown as the mean ± SD, evaluated by one-way ANOVA followed by Tukey’s post hoc test. *p<0.05; **p<0.01; ***p<0.001.


