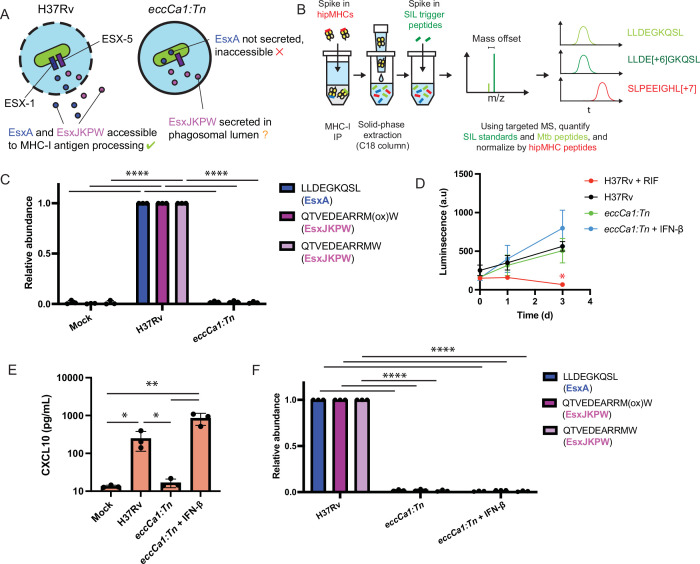
Figure 3. ESX-1 activity is required for presentation of EsxA28-36 and EsxJKPW24-34 on MHC-I, independently of type I interferon signaling.
(A) Schematic representation of the localization of EsxA and EsxJKPW in macrophages infected with wild-type Mtb H37Rv or the ESX-1-deficient eccCa1:Tn transposon mutant. (B) Schematic showing our workflow for targeted detection and quantification of Mtb-derived MHC-I peptides by SureQuant, using stable isotope labeled peptide-MHC complexes (hipMHCs) as internal standards. SIL: stable isotope labeled. (C) Relative quantification of EsxA28-36 and EsxJKPW24-34 by SureQuant in macrophages infected with no Mtb (mock), wild-type Mtb H37Rv, or eccCa1:Tn for n=3 donors (all HLA-A*02:01+, HLA-B*57:01+). As oxidation of methionine is common during sample handling, both the oxidized and non-oxidized form of EsxJKPW24-34 were quantified. (D) Luminescence as a function of time measured for macrophages infected with luciferase-expressing Mtb, in a wild-type H37Rv or eccCa1:Tn background, with or without the addition of 10 ng/mL IFN-β in the culture media. Addition of 25 µg/mL rifampicin (RIF) to the culture media was used as a control showing reduced luminescence with bacterial death. Data points and error bars represent the mean and standard deviation of n=3 donors, each of which represents the mean of three technical replicates. (* p<0.05, one-way ANOVA with Dunnett’s multiple comparisons test, relative to H37Rv as the reference condition). (E) CXCL10 concentration in the culture media 72 hr post-infection quantified by ELISA. Data points each represent the mean of three technical replicates for a given donor. (* p<0.05, ** p<0.01, one-way ANOVA with Tukey’s multiple comparisons test on log-transformed concentrations.) (f) Relative quantification of EsxA28-36 and EsxJKPW24-34 by SureQuant in macrophages infected with no Mtb (mock), wild-type Mtb H37Rv, or eccCa1:Tn for n=3 donors (all HLA-A*02:01+, HLA-B*57:01+). (**** p<0.001, one-way ANOVA with Tukey’s multiple comparisons test.). Error bars indicate standard deviation.


