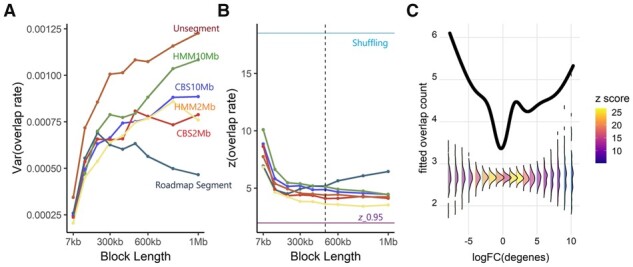
Figure 2.

Parameter selection and overlap analysis. (A) Variance of the rate of overlaps and (B) z score for the overlap, for different segmentations and on the liver dataset. (C) GAM predicted curves for observed (black line) and bootstrapped data (densities), for the overlap count over gene logFC. Conditional densities are colored by the z score for the overlap.
