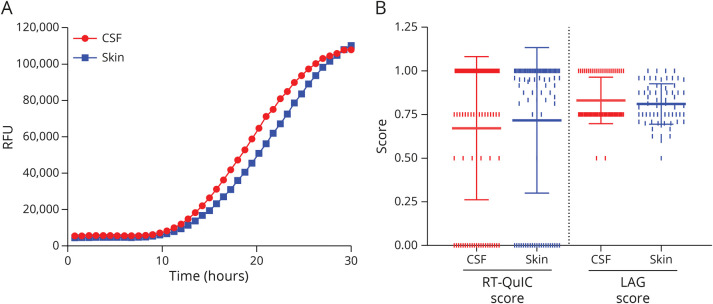
Figure 2. Comparison of AS Seeding Activity in the Skin and CSF of Patients With IRBD.
Comparison of α-synuclein RT-QuIC kinetics of fluorescence emission between the skin (mean of all positive sites) and CSF. Bars indicating the SEM were omitted to improve the readability. (B) Comparison of the number of positive replicates (RT-QuIC score, left) and LAG times (LAG score, right) between the skin (mean of all positive sites) and CSF. Only participants with CSF and at least 1 RT-QuIC positive skin site were evaluated (n = 87). The RT-QuIC and LAG scores are plotted as mean ± SD (see Methods for score calculation). The vertical pipes indicate individual values. AS = misfolded α-synuclein; IRBD = isolated REM sleep behavior disorder; RFU = relative fluorescence units; RT-QuIC = real-time quaking-induced conversion.

