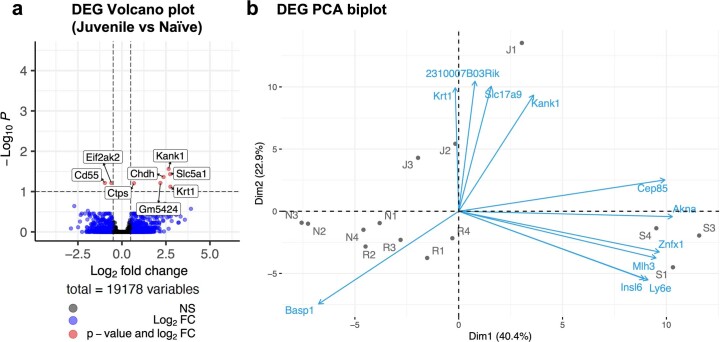
Extended Data Fig. 7. Juvenile Naïve USCs have a different gene expression profile with the other cell types, related to Fig. 4.
RNA was isolated from Juvenile Naïve, Adult Naïve, Resolved and Sensitized USCs (cell lines of n = 3, n = 4, n = 4, n = 3 from 14 mice). Then, an RNA-seq analysis was performed as described in Fig. 4a. Significance was determined by Wald test followed by multiple test correction using Benjamini-Hochberg FDR for adjusted p-value. (A) A volcano plot of differentially expressed genes (DEGs) comparing Juvenile Naïve vs Adult Naïve USCs identify 8 significantly DEGs (FDR cutoff 0.1). (B) The PCA biplot for the PCA shown in Fig. 4a indicates how strongly each gene influences the principal components (PC). Genes including Znfx1 and Ly6e strongly influence PC1 (Dim1) while genes including Kank1 and Krt1 strongly influence PC2 (Dim2).

