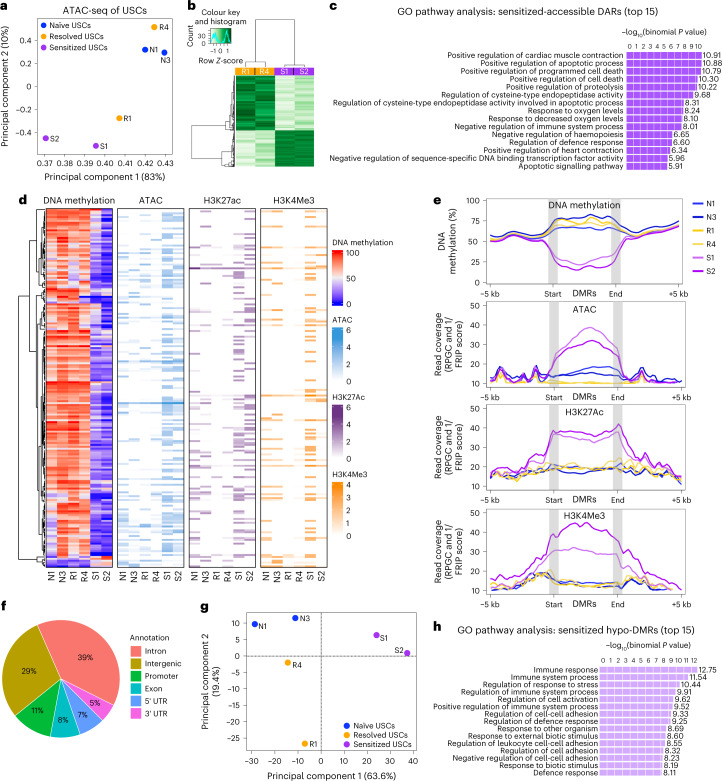
Fig. 3. Convalescent mouse USCs have differential epigenetic memories upon UPEC infection.
Omni-ATAC-seq was performed using USCs from naïve, resolved and sensitized mice (cell lines N1, N3, R1, R4, S1 and S2, each from an individual mouse). a, PCA plot of DARs across the USC lines. b, Heat map of significantly differential peaks (FDR < 0.05) comparing sensitized vs resolved USCs. Out of all 2,880 DARs, 925 regions are sensitized-accessible DARs and 1,955 regions are resolved-accessible DARs. c, The top 15 enriched GO terms for sensitized-accessible DARs (n = 747, fold change >1.5, FDR < 0.05) were analysed using GREAT. Significance was determined using the binomial test. d,e, Differences in chromatin accessibility, DNA methylation and active histone modifications, H3K27Ac and H3K4Me3, in different USCs were assessed by ATAC-seq, whole genome bisulfite sequencing (WGBS) and CUT&RUN. d, Sensitized-specific DMRs (n = 189) among naïve, resolved and sensitized USCs are visualized as a series of heat maps displaying the epigenetic landscape overlapping each DMR for DNA methylation, ATAC and active histone modifications H3K27Ac and H3K4Me3. e, Average signals 5 kb upstream and 5 kb downstream of sensitized-specific hypo-DMRs (n = 183) for WGBS, ATAC, H3K27Ac and H3K4Me3 are visualized for each cell line. Average length of DMRs is 362 base pairs. DMRs are scaled for size with ‘start’ and ‘end’ of DMRs, which are indicated as grey bars. f, Sensitized-specific hypo-DMRs were annotated according to their predicted locations in the genome (n = 183). g, A PCA plot of all DMR comparisons showing clustering of the different cell lines. h, The top 15 enriched GO terms for sensitized hypo-DMRs were analysed using GREAT (n = 183).

