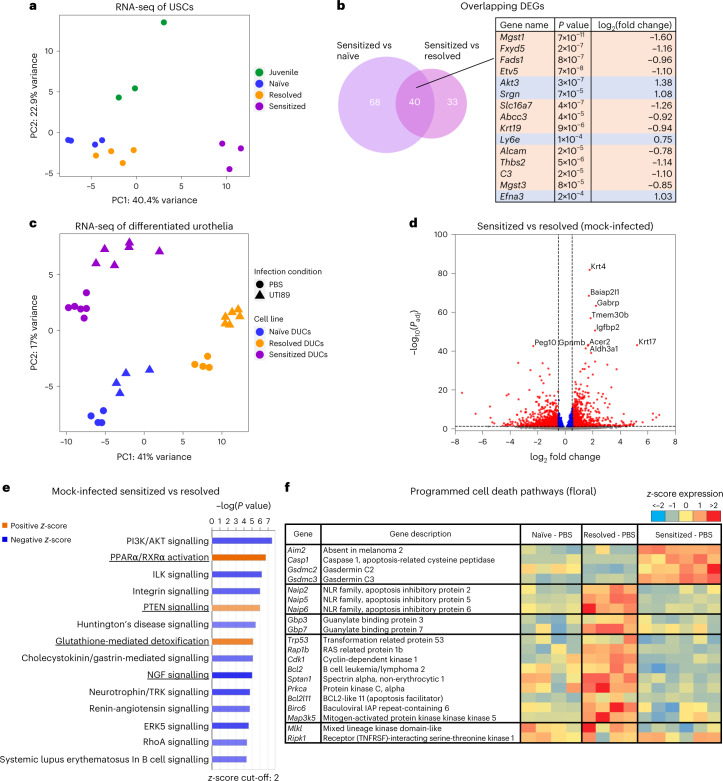
Fig. 4. Differentiated urothelia originating from convalescent mice maintain differential transcriptomics observed in vivo.
RNAs were isolated from (a,b) undifferentiated juvenile naïve, adult naïve, resolved and sensitized USCs (cell lines of n = 3, n = 4, n = 4, n = 3 from 14 mice), or (c–f) differentiated urothelia of naïve, resolved and sensitized cells (different cultures from N3, R3 and S3) with or without UPEC infection, then analysed by RNA-seq and by differential analysis. a, A PCA of USC RNA-seq by significantly differentially expressed genes shows that samples are clustered by cell lines (previous infection outcome). b, Forty differentially expressed genes (DEGs) were overlapping between sensitized vs naïve and sensitized vs resolved USCs. The top 15 overlapping DEGs are listed in the table. c, A PCA of differentiated urothelial RNA-seq shows clustering by cell lines (previous infection outcome) and secondary infection condition. d, A volcano plot comparing mock-infected sensitized vs resolved differentiated urothelia. DEGs with FC >0.5, Padj <0.05 are indicated as red dots. e, Pathway analysis was used to assess the biological pathways enriched in differentially expressed genes in mock-infected sensitized relative to resolved differentiated urothelia. Significance was determined using a right-tailed Fisher’s exact test, with Padj < 0.05 being considered as significantly enriched pathways. Shown are selected pathways with z-score >2 and –log(P value) >4.2 from the specific enriched pathways by IPA. Pathways overlapping between mock-infected and UPEC-infected differentiated urothelia (Extended data Fig. 8d) are underlined. f, A heat map showing programmed cell death associated genes that are differentially expressed in mock-infected naïve, resolved and sensitized differentiated urothelia. Significance of DEGs was determined using Wald test, followed by multiple test correction using Benjamini-Hochberg FDR for adjusted P value.

