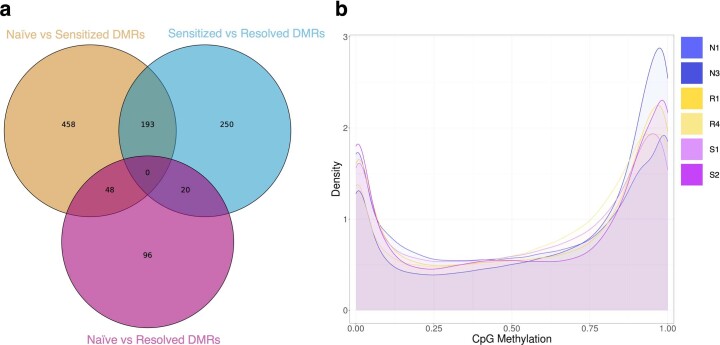
Extended Data Fig. 4. DNA methylation distribution for cell lines and cell line-specific differentially methylated regions (DMRs).
(A) Venn diagram of all the DMR comparisons with the numbers of each of the comparisons. The Sensitized-specific DMRs are shown in the overlap between Naïve vs Sensitized and Sensitized vs Resolved DMR comparisons. (B) The density of CpG methylation shows a bimodal distribution with no global differences in DNA methylation between the three groups (Naïve, Resolved and Sensitized USCs), where CpG methylation represents the fraction of total reads that are methylated per CpG site.

