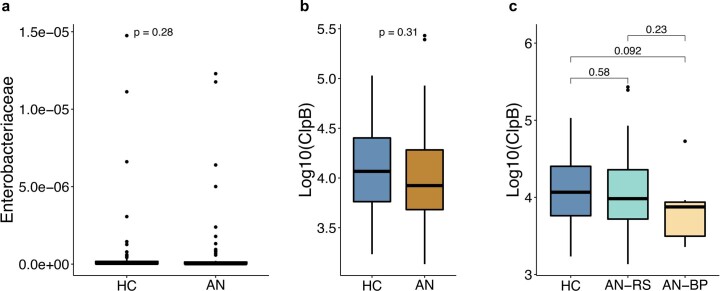
Extended Data Fig. 5. Fasting plasma concentration of Caseinolytic protease B (ClpB) in control subjects and AN subtypes.
a, Relative abundance of Enterobacteriaceae family in HC (n = 70) and AN (n = 77) groups. b, Log-scale transformed fasting plasma ClpB concentration between HC (n = 70) and AN (n = 77) groups. c, Log-scale transformed fasting plasma ClpB concentration between restrictive AN (AN-RS n = 56) and binge-purge AN (AN-BP n = 21) subtypes. Significance was calculated by two-sided Wilcoxon rank-sum test between two groups (a-c). Box plots indicate median and interquartile range (IQR) and whiskers represent 1.5× IQR (a-c).

