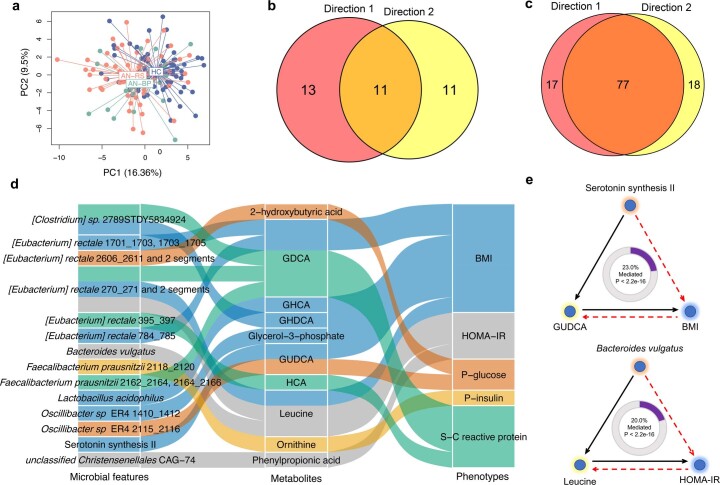
Extended Data Fig. 8. In silico analysis using bidirectional mediation inference.
a, Principal component analysis (PCA) plot of the serum metabolome of AN subtypes, AN-BP (binge/purge anorexia), AN-RS (restrictive anorexia). b, Summary number of inferred mediation relationship for direction 1 (gut microbial features → eating disorder scores mediated by serum metabolites), direction 2 (gut microbial features → serum metabolites mediated by eating disorder scores). c, Summary number of inferred mediation relationship for direction 1 (gut microbial features → phenotypes mediated by serum metabolites), direction 2 (gut microbial features → serum metabolites mediated by phenotypes) for the whole cohort. d, Sankey diagram showing the inferred causal relationship network of direction 1 where gut microbial features including bacterial species, gut brain and metabolic modules, and bacterial genetics were treated as causal factors, serum metabolites are mediators, and metabolic traits are outcomes. e, Examples of inferred causal relationships between gut microbial features, metabolites, and host metabolic traits. Direction 1that means microbial features → metabolic traits mediated by serum metabolites is illustrated with a black line while direction 2 that means microbial features → serum metabolites mediated by metabolic traits is illustrated with a stipulated red line. The proportion of mediation effect are shown at the center of ring charts. GDCA, glycodeoxycholic acid; GHCA, glycohyocholic acid; GHDCA, glycohyodeoxycholic acid; GUDCA, glycoursodeoxycholic acid; HCA, hyocholic acid; HOMA-IR homeostatic model assessment of insulin resistance; P-, plasma; S-, serum.

