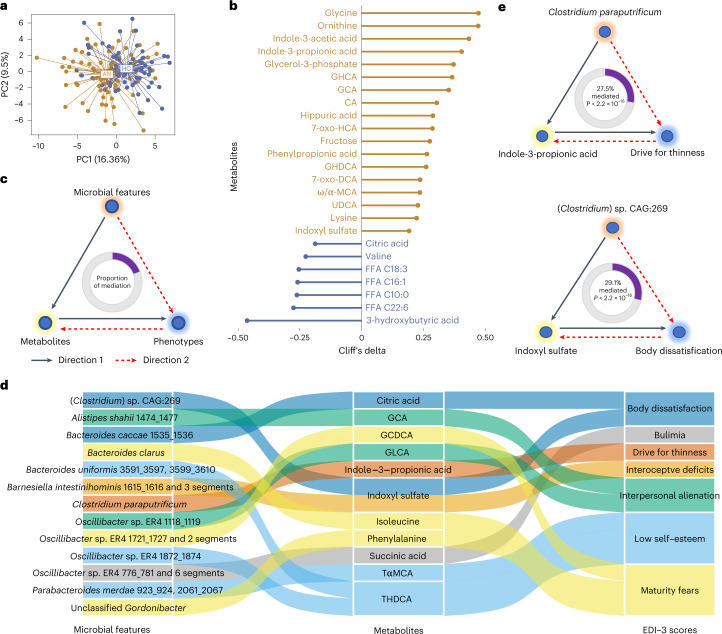
Fig. 5. Serum metabolites differ between AN cases and controls and may be mediating the impact of gut microbial features on eating disorder traits.
a, Principal component analysis (PCA) of the serum metabolome profile of AN cases and HC participants. b, Cliff’s delta values of contrasted metabolites between AN (n = 77) and HC (n = 70) after adjusting for age, BMI, smoking and multiple drug intake. Gold lollipops are metabolites enriched in AN, and blue lollipops show serum metabolites enriched in HC. c, Workflow for the bidirectional mediation analysis for gut microbial features, serum metabolites and host phenotypes. d, Sankey diagram showing the inferred causal relationship network of direction 1 where gut microbial features including bacterial species, gut brain/metabolic modules and bacterial genetics were treated as causal factors, metabolites are mediators, and EDI-3 scores are outcomes. e, Examples of inferred causal relationships between microbial features, metabolites and EDI-3 scores. Direction 1 means microbial features → eating disorder scores mediated by metabolites, illustrated with a black line; direction 2 means microbial features → metabolites mediated by EDI-3 scores, illustrated with a dashed red line. The proportions of mediation effects are shown at the centre of ring charts. FFA, free fatty acid.

