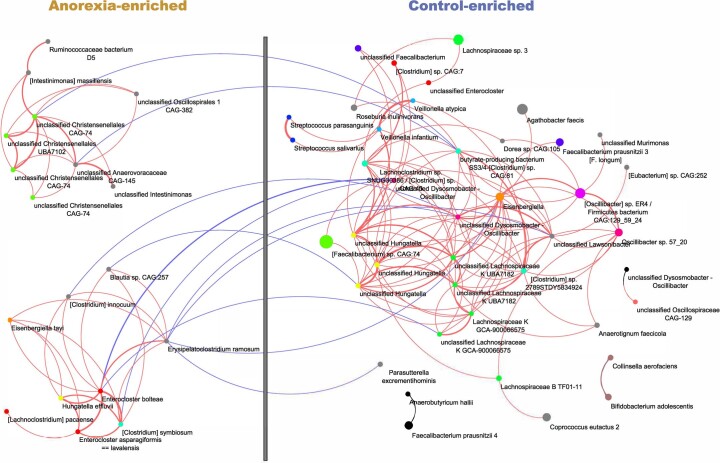
Extended Data Fig. 3. Co-occurrence network deducted from bacterial species enriched in AN cases (left) and healthy controls (right) after drug-deconfounding.
Node size and node colour represent the mean abundance and the genus of a given MSP, respectively. Genera represented by only one MSP are coloured in grey. Red and blue lines indicate positive and negative correlations, respectively. Line thickness represents the absolute correlation coefficient. Only correlations with an absolute coefficient above 0.4 are shown; MSP without any correlation above the threshold are hidden.

