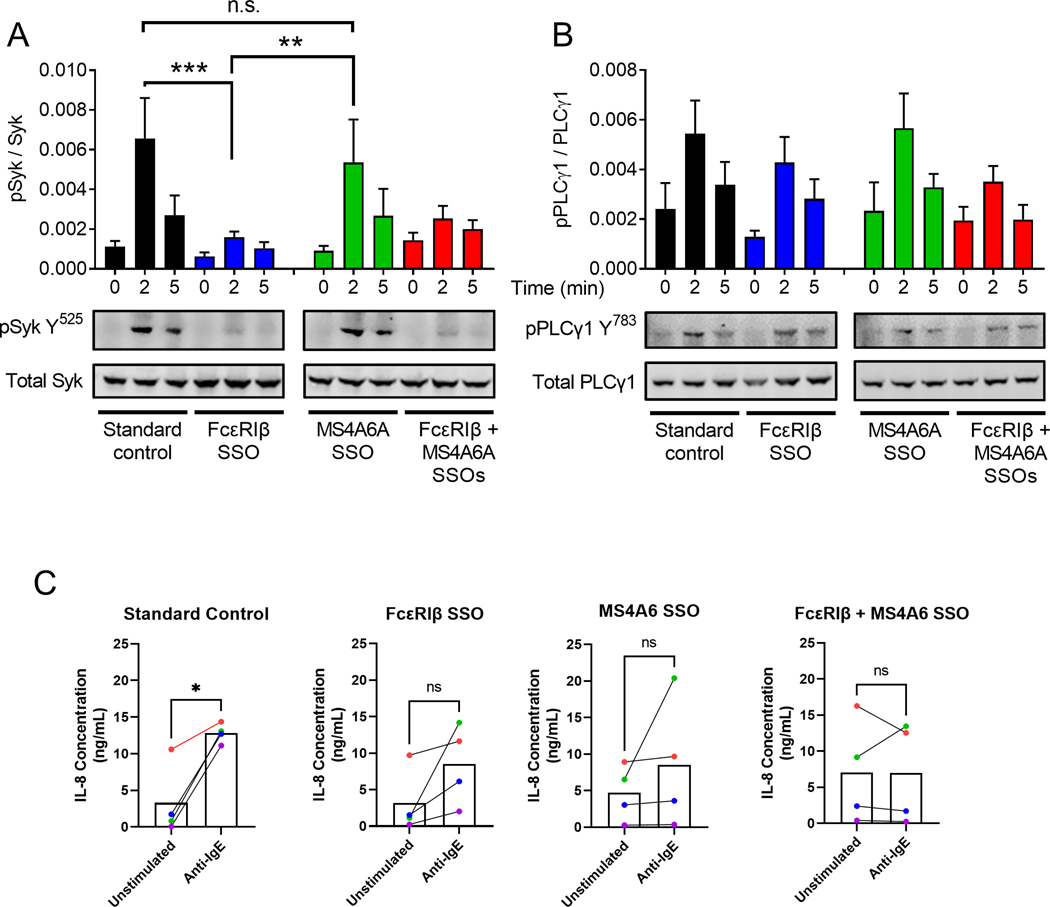
Figure 7: FcεRIβ and MS4A6A promote differential phosphorylation of Syk, but not PLCγ1.
(A) Western blot analysis and quantification of phosphorylated Syk (Y525) corrected for total Syk using dual colour analysis with Licor Odyssey imaging. (B) Western blot analysis and quantification of phosphorylated PLCγ1 (Y783) corrected for total PLCγ1. (A-B) Black bars represent standard control oligonucleotide. Blue bars represent FcεRIβ SSO. Green bars represent MS4A6A SSO. Red bars represent FcεRIβ + MS4A6A SSOs. (C) IL-8 ELISA data from HLMC challenged with anti-IgE (1000 ng/mL). Each colour represents a different HLMC donor. The same donors were used for each SSO condition. Data are the mean±SEM from at least three independent experiments. *P < 0.05, **P < 0.01, ***P < 0.001, ANOVA with post-test (A, B) or paired two tailed t-test (C).

