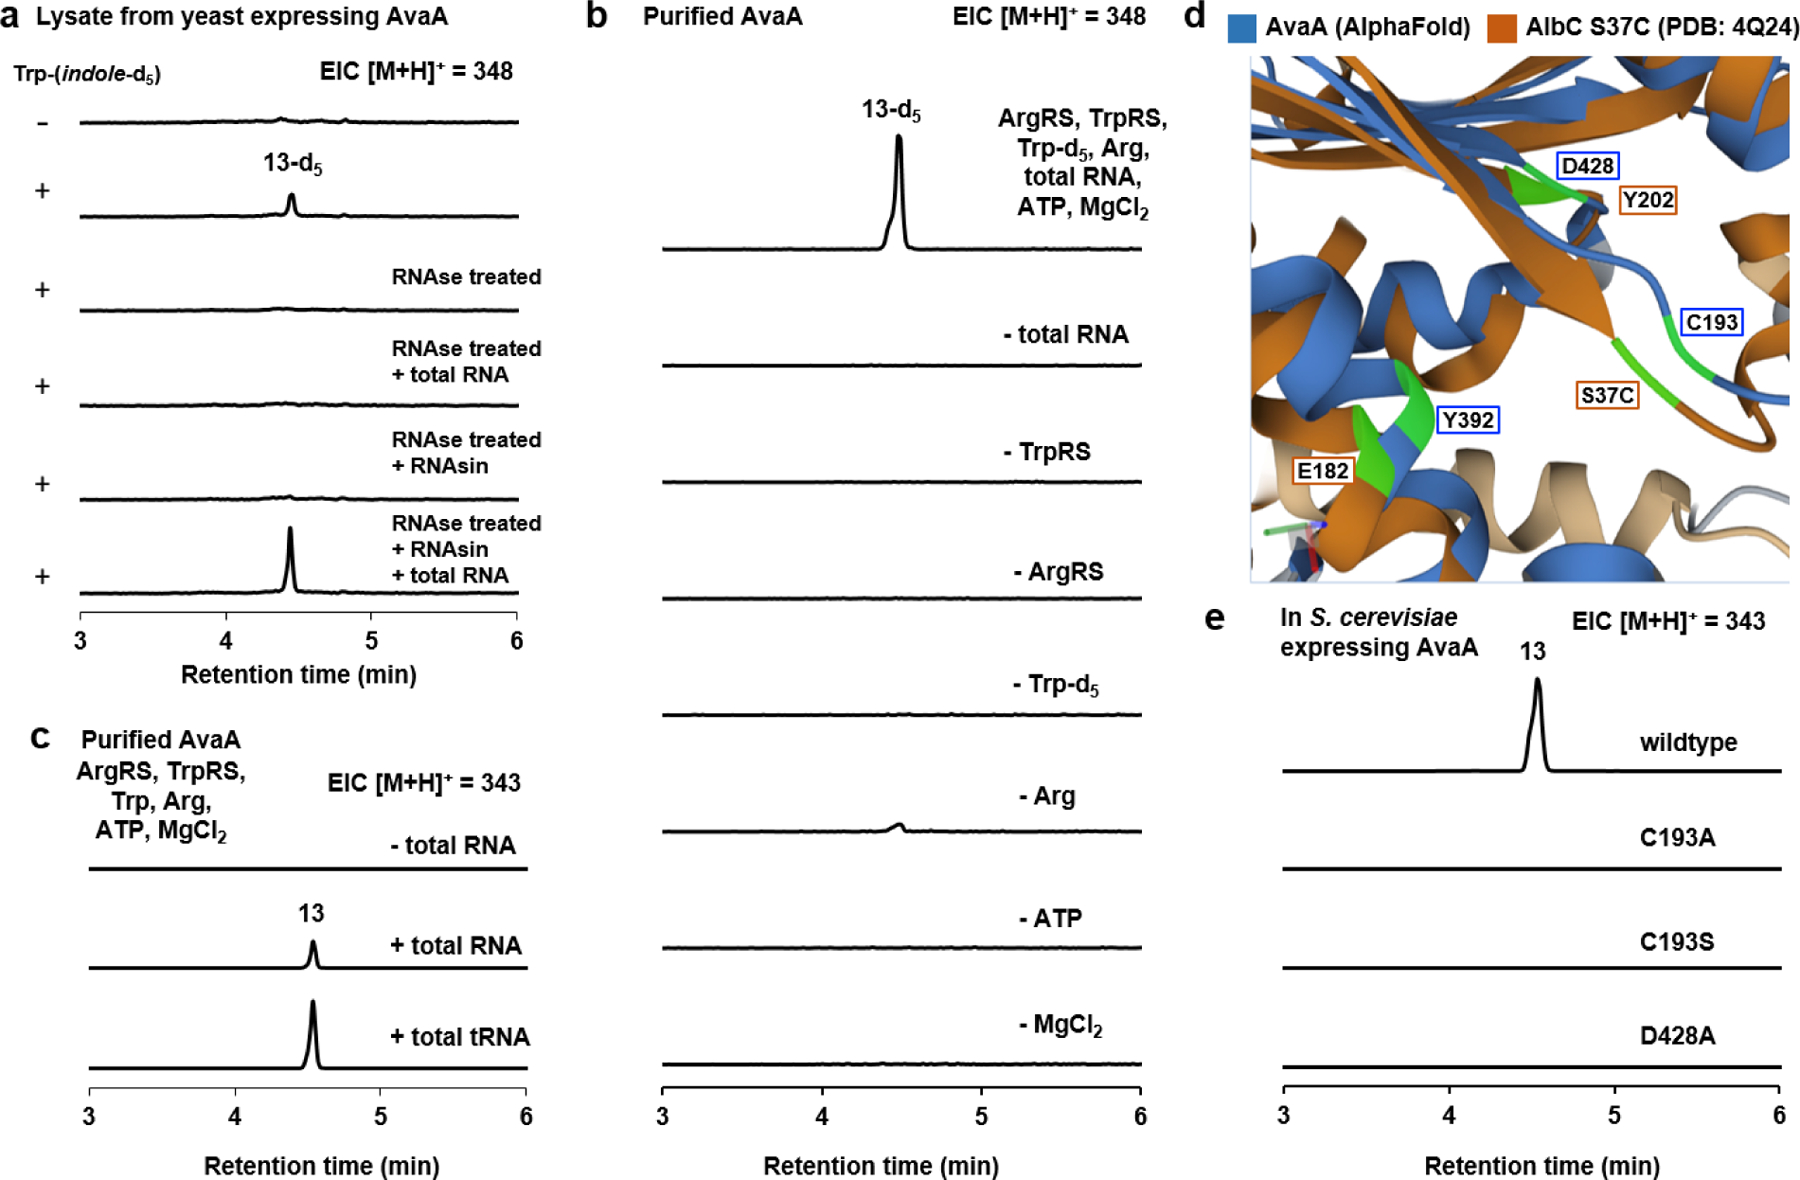
Fig. 3. Biochemical characterization of AvaA.

a) QTOF analysis of yeast lysate containing AvaA assayed in the presence of l-Trp-(indole)-d5. In samples treated with RNase, amino acid substrates, RNasin and total RNA were added after RNase treatment as indicated. b) In vitro assays with purified AvaA, ArgRS, TrpRS, deacylated yeast total RNA, amino acids and cofactors. Removal of any component led to loss of cyclodipeptide synthesis. The residual amount in the – Arg sample is attributed to incomplete deacylation of the total RNA sample. c) In vitro assays with purified AvaA, ArgRS, TrpRS, purified yeast tRNA, unlabeled substrates, and cofactors. d) Overlay of AlbC S37C mutant (brown) and AvaA model (blue) generated by AlphaFold. AlbC S37C structure (4Q24) was used because a suicide substrate analogue was co-crystallized in the enzyme active site. The dark blue and dark brown portions correspond to regions with similar structure, whereas the gray (AvaA) and beige (AlbC) correspond to regions with low similarity. The active site residues that are compared are highlighted in green. Predicted distances between the compared residues using RCSB Pairwise Structure Alignment (http://https://www.rcsb.org/alignment) are: AvaA C193/AlbC S37C: 2.06 Å; AvaA D428/AlbC Y202: 2.34 Å; AvaA Y392/AlbC E182: 2.58 Å. e) QTOF analysis of the extracts from yeast expression of wild type AvaA and C193A, C193S, and D428A mutants.
