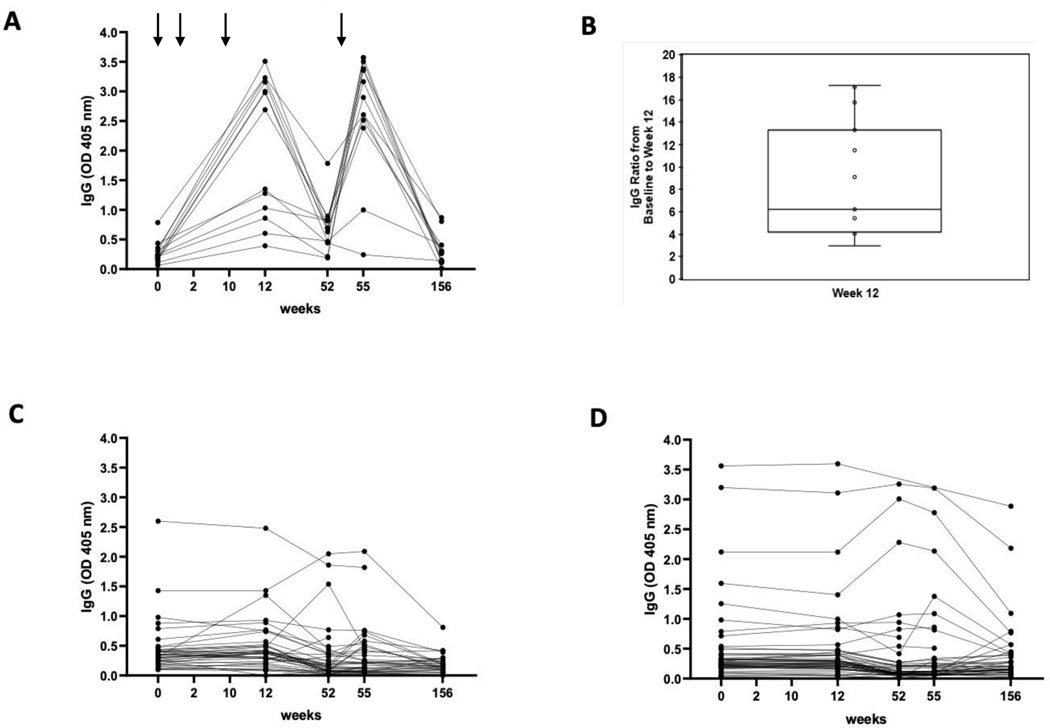
Figure 2: anti-MUC1 IgG Levels:
(A) among MUC1 vaccine recipients with an immune response (N=13); (B) Fold elevation in anti MUC1 IgG among vaccine recipients with an immune response; (C) among vaccine recipients without an immune response (N=39); (C) among placebo controls (N=50). Arrows indicate timing of vaccine administration. Blood sampling occurred at the weeks enumerated on the X-axis. Results are shown for 1:80 plasma dilution.

