
Figure 2: Example images with AI-generated and Medical Image Analyst corrected segmentations.
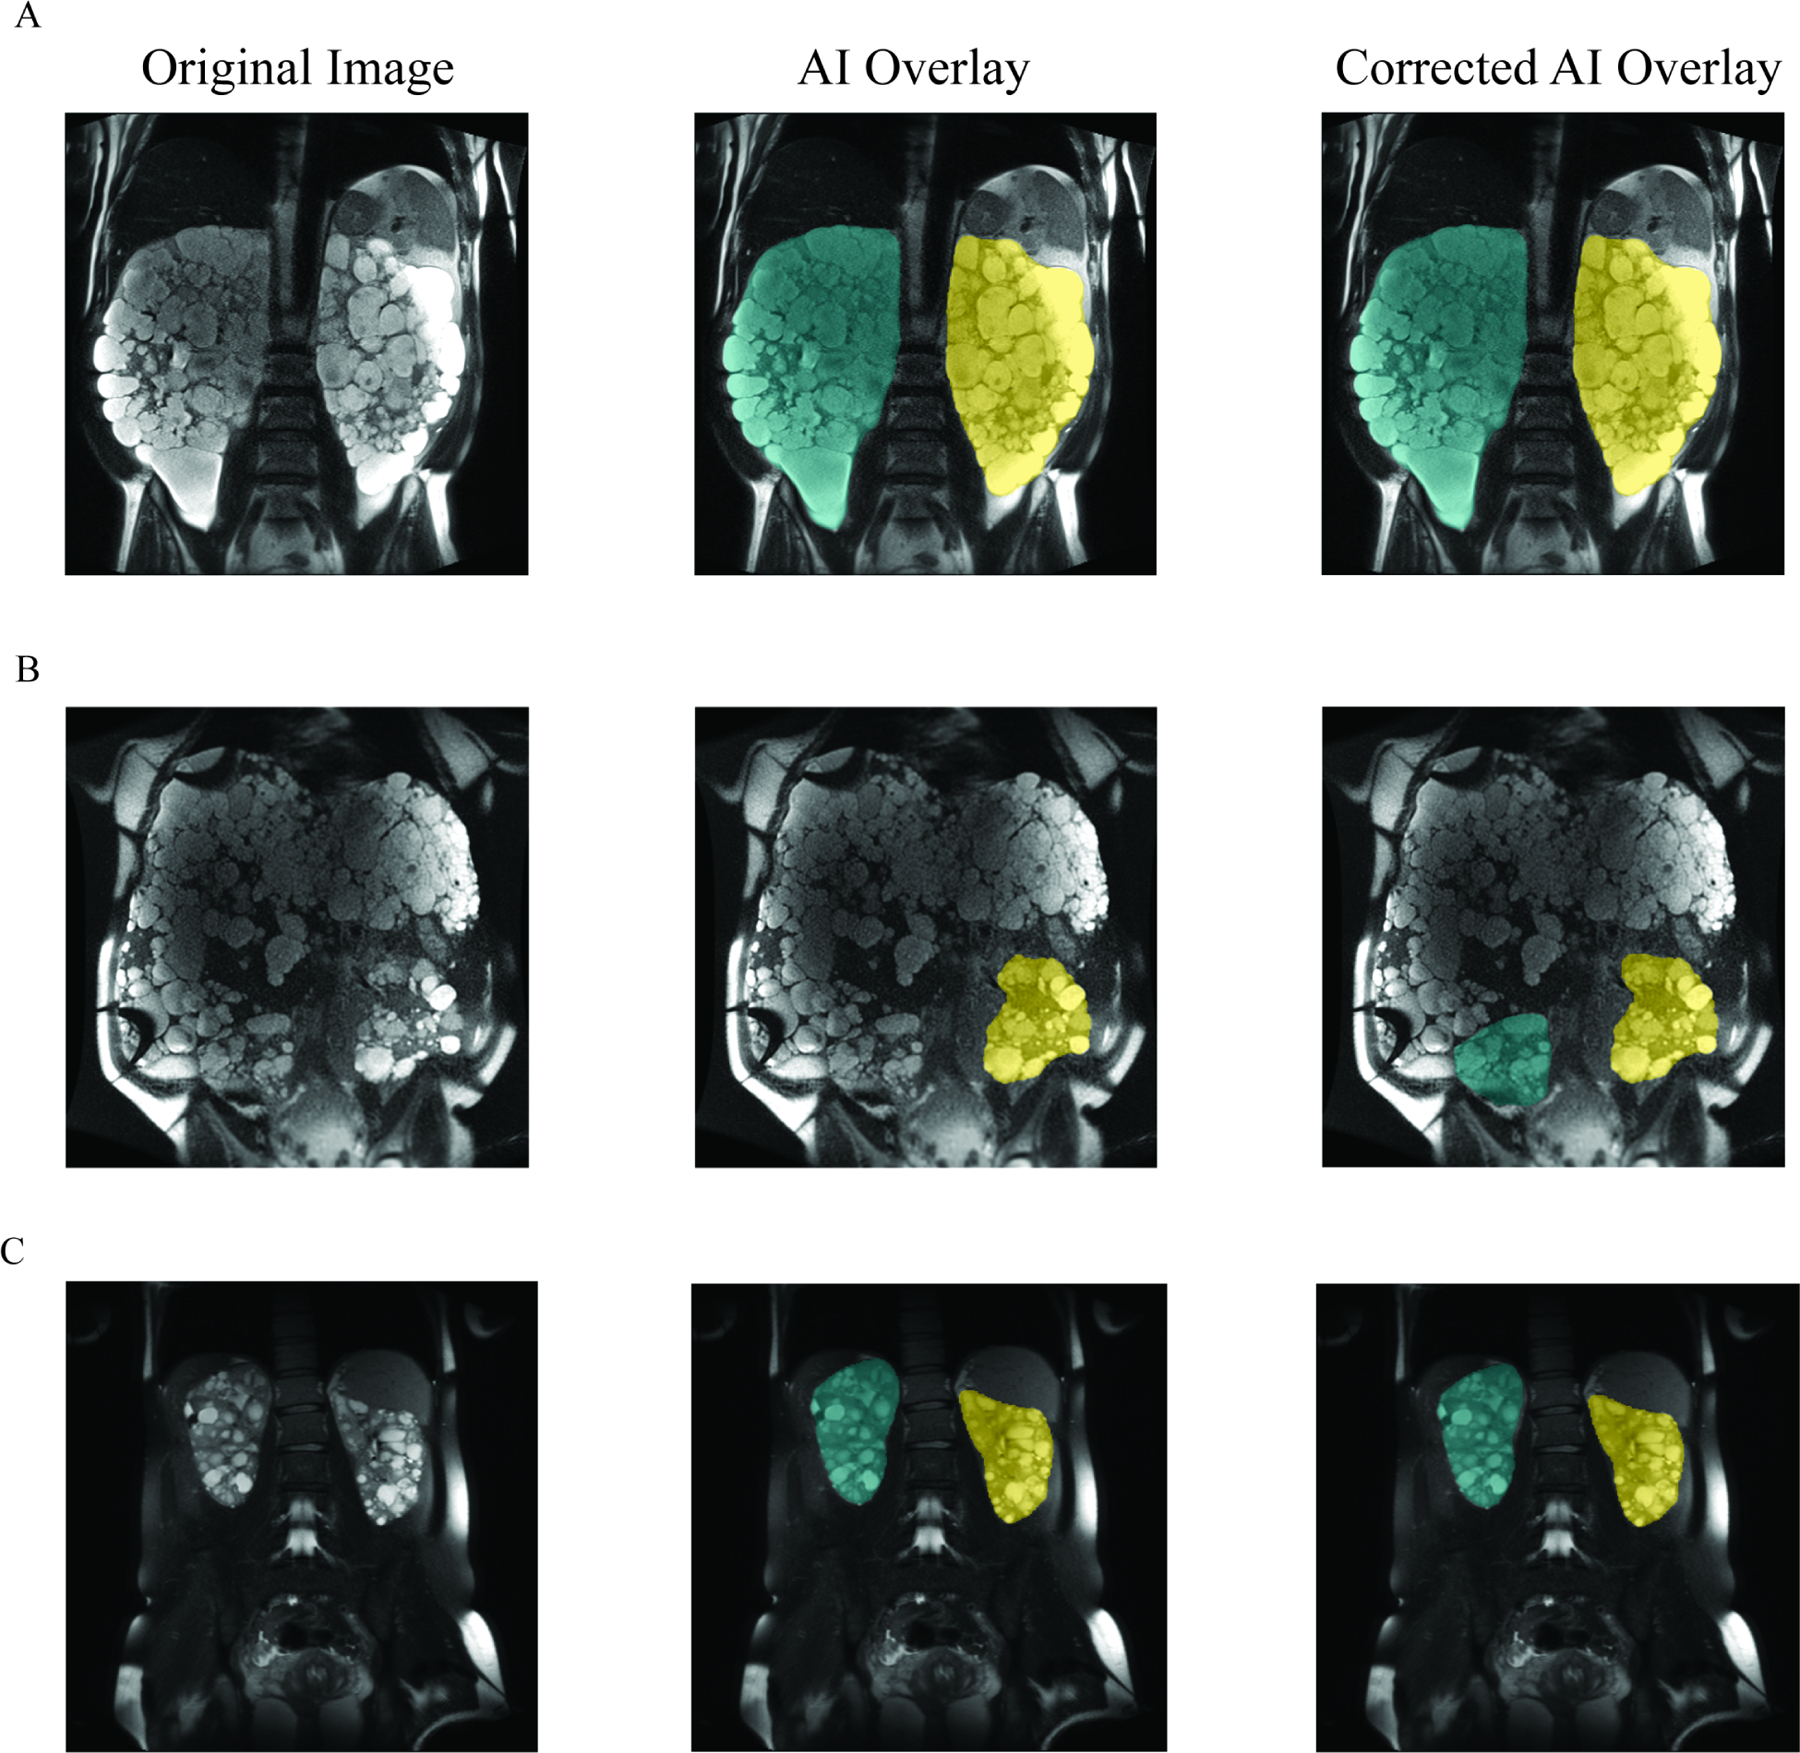
Panel A shows the original CT image (left), original image with AI-generated TKV segmentation overlay (middle), original image plus medical image analyst corrected AI overlay (right) from a case with max Dice score (0.99). Left kidney segmentation is shown in yellow and right kidney segmentation is shown in green. Panel B shows minimum Dice score (0.77) example. Panel C shows median Dice score (0.98) example.