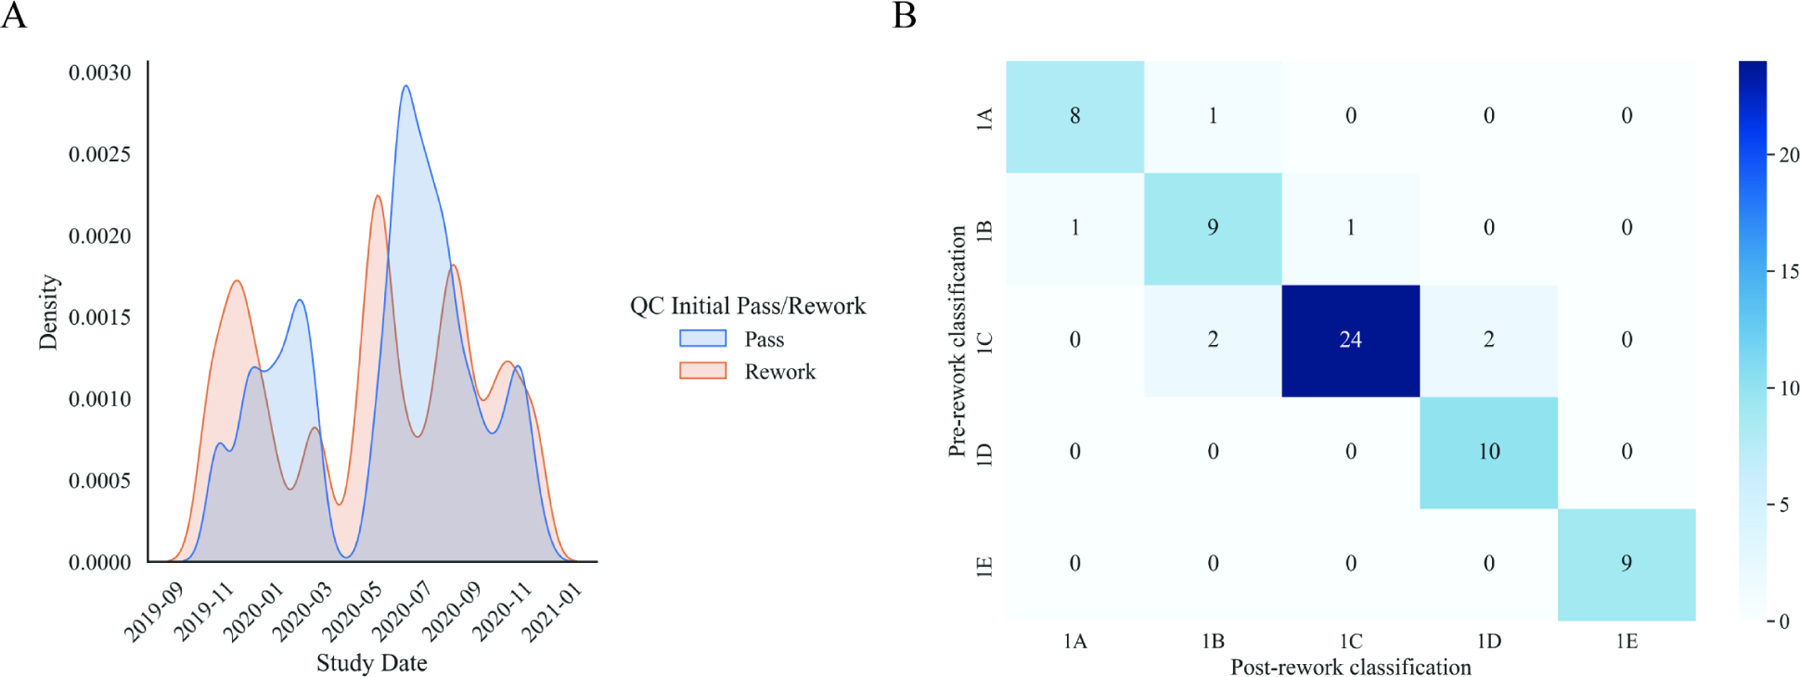
Figure 4: Comparing study date distributions between pass and rework and comparing classification of typical ADPKD pre- or post-rework pathway.

Panel A shows kernel density estimated distributions of study dates between pass (blue) and rework (orange) pathways that are not significantly different (two-sample Kolmogorov-Smirnov test, P=.08). Panel B represents an agreement heatmap between AI (pre-rework) and corrected AI (post-rework) typical ADPKD classification for all patients (weighted Cohen’s kappa= 0.86). Diagonal represents perfect agreement. The darker the shade of blue represents greater counts.
