
Extended Data Fig. 7 |. Cryo-EM data analysis for KDM2B-nucleosome complex.
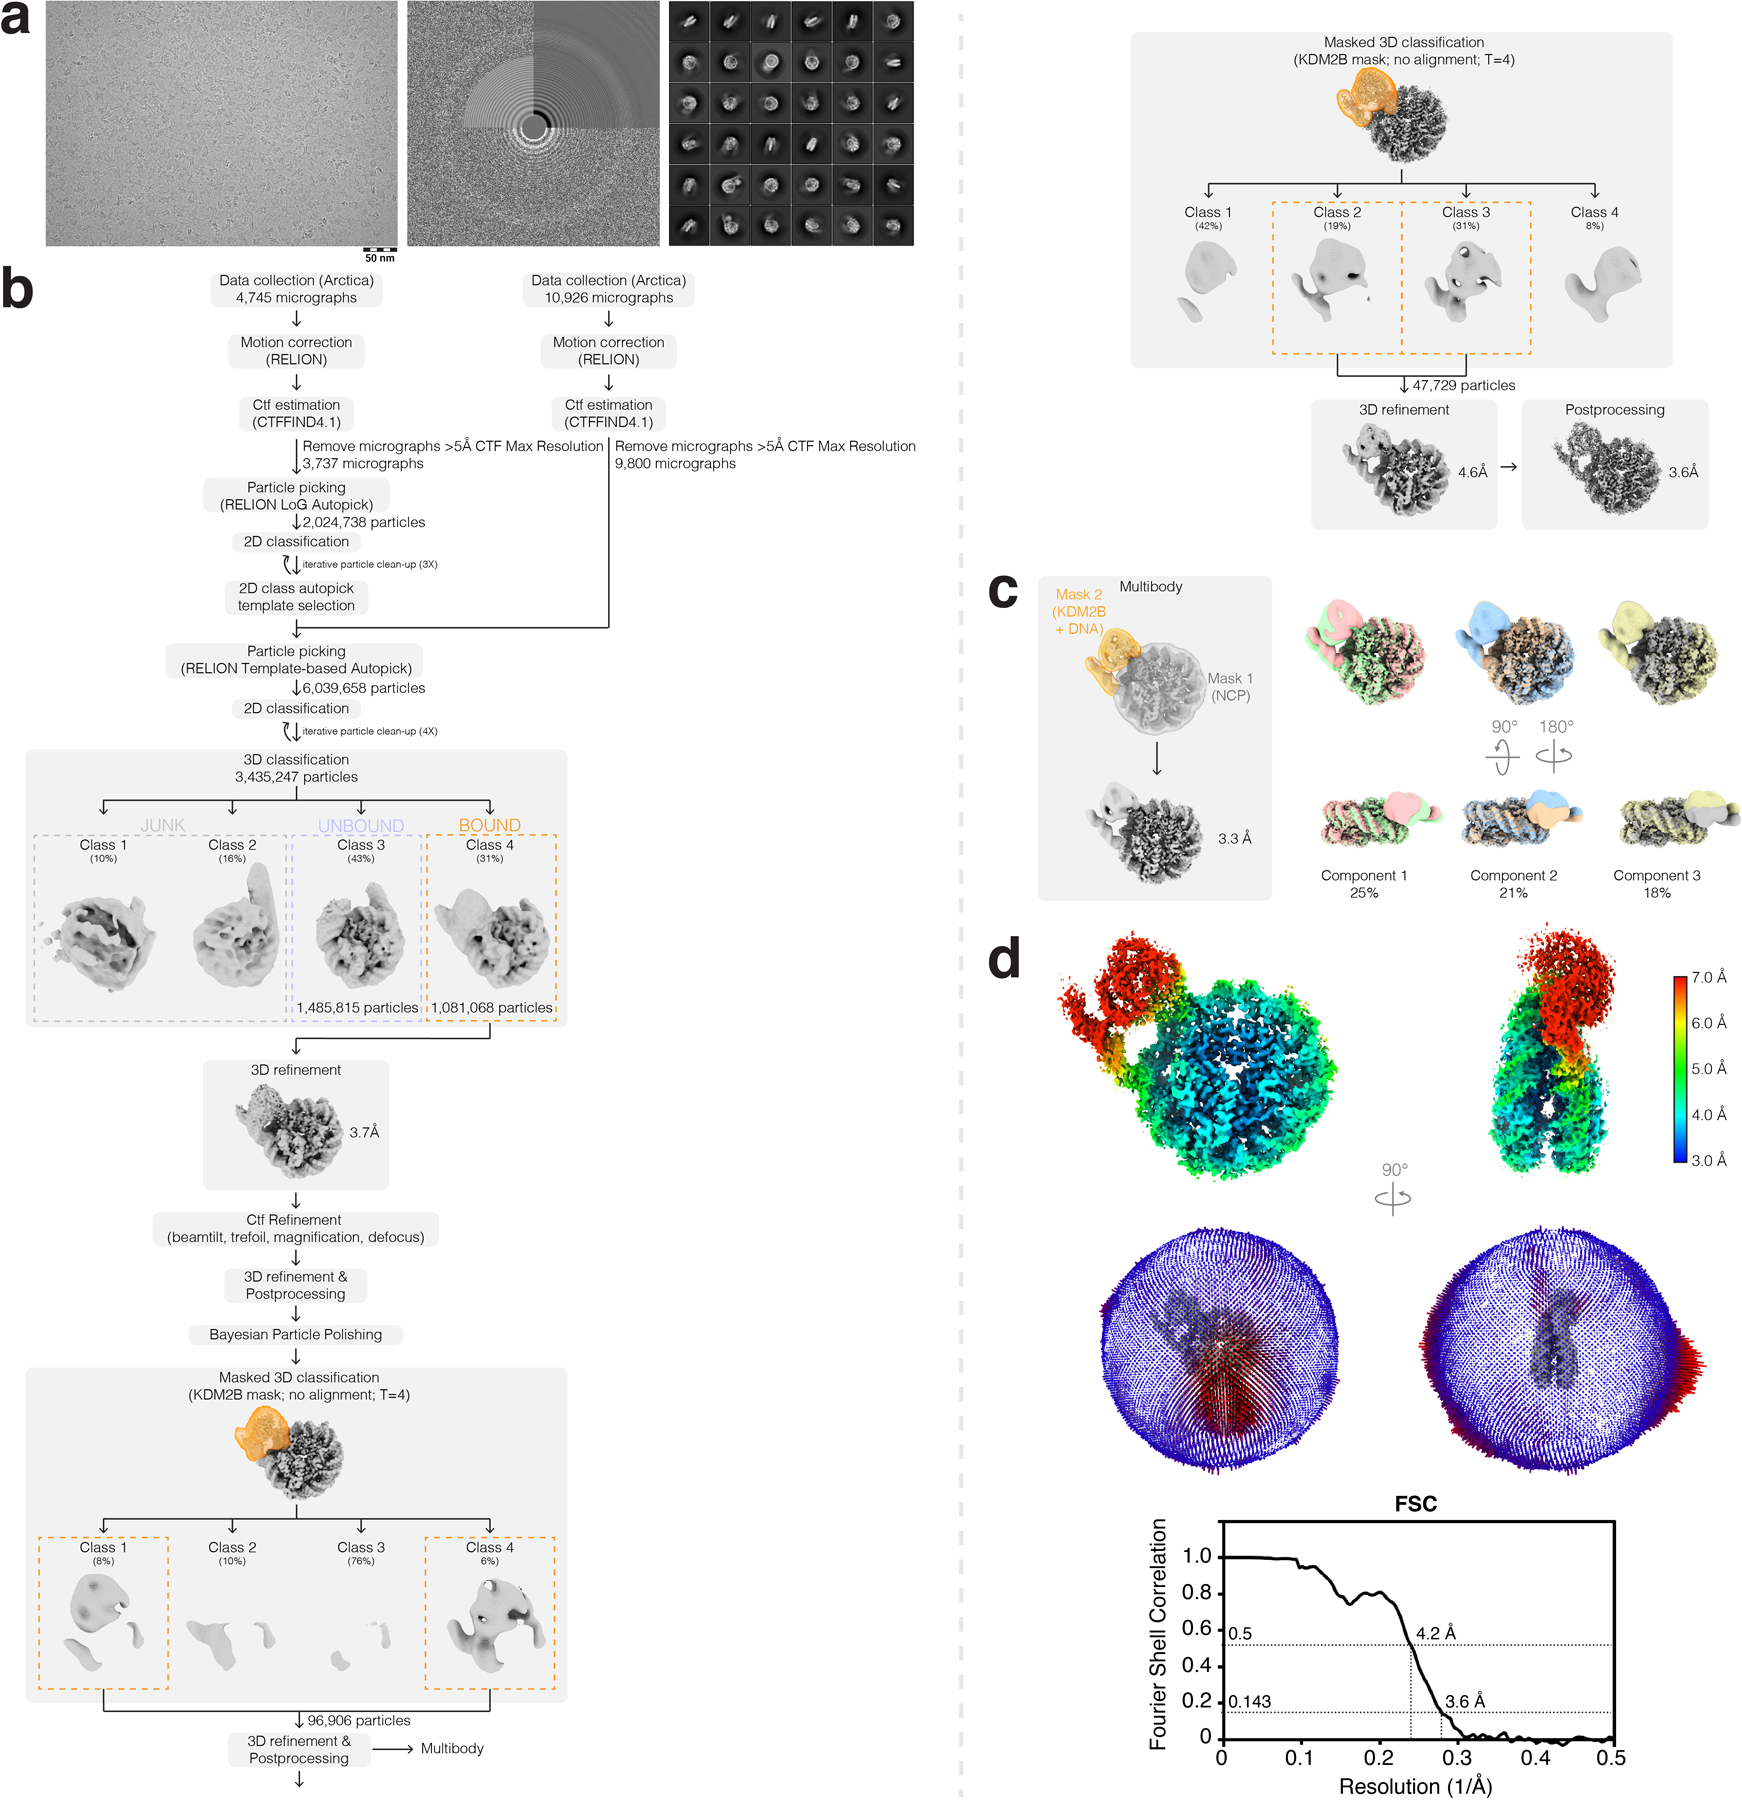
a, Representative micrograph (left), CTF estimation (middle), and 2D classes (right) from KDM2B-nucleosome complex dataset. b, Cryo-EM data analysis workflow carried out in RELION-3.1. c, Multibody refinement analysis results from RELION. d, Final postprocessed map colored by local resolution (top), angular distribution of particles (middle), and FSC curve (bottom) for KDM2B-nucleosome complex.