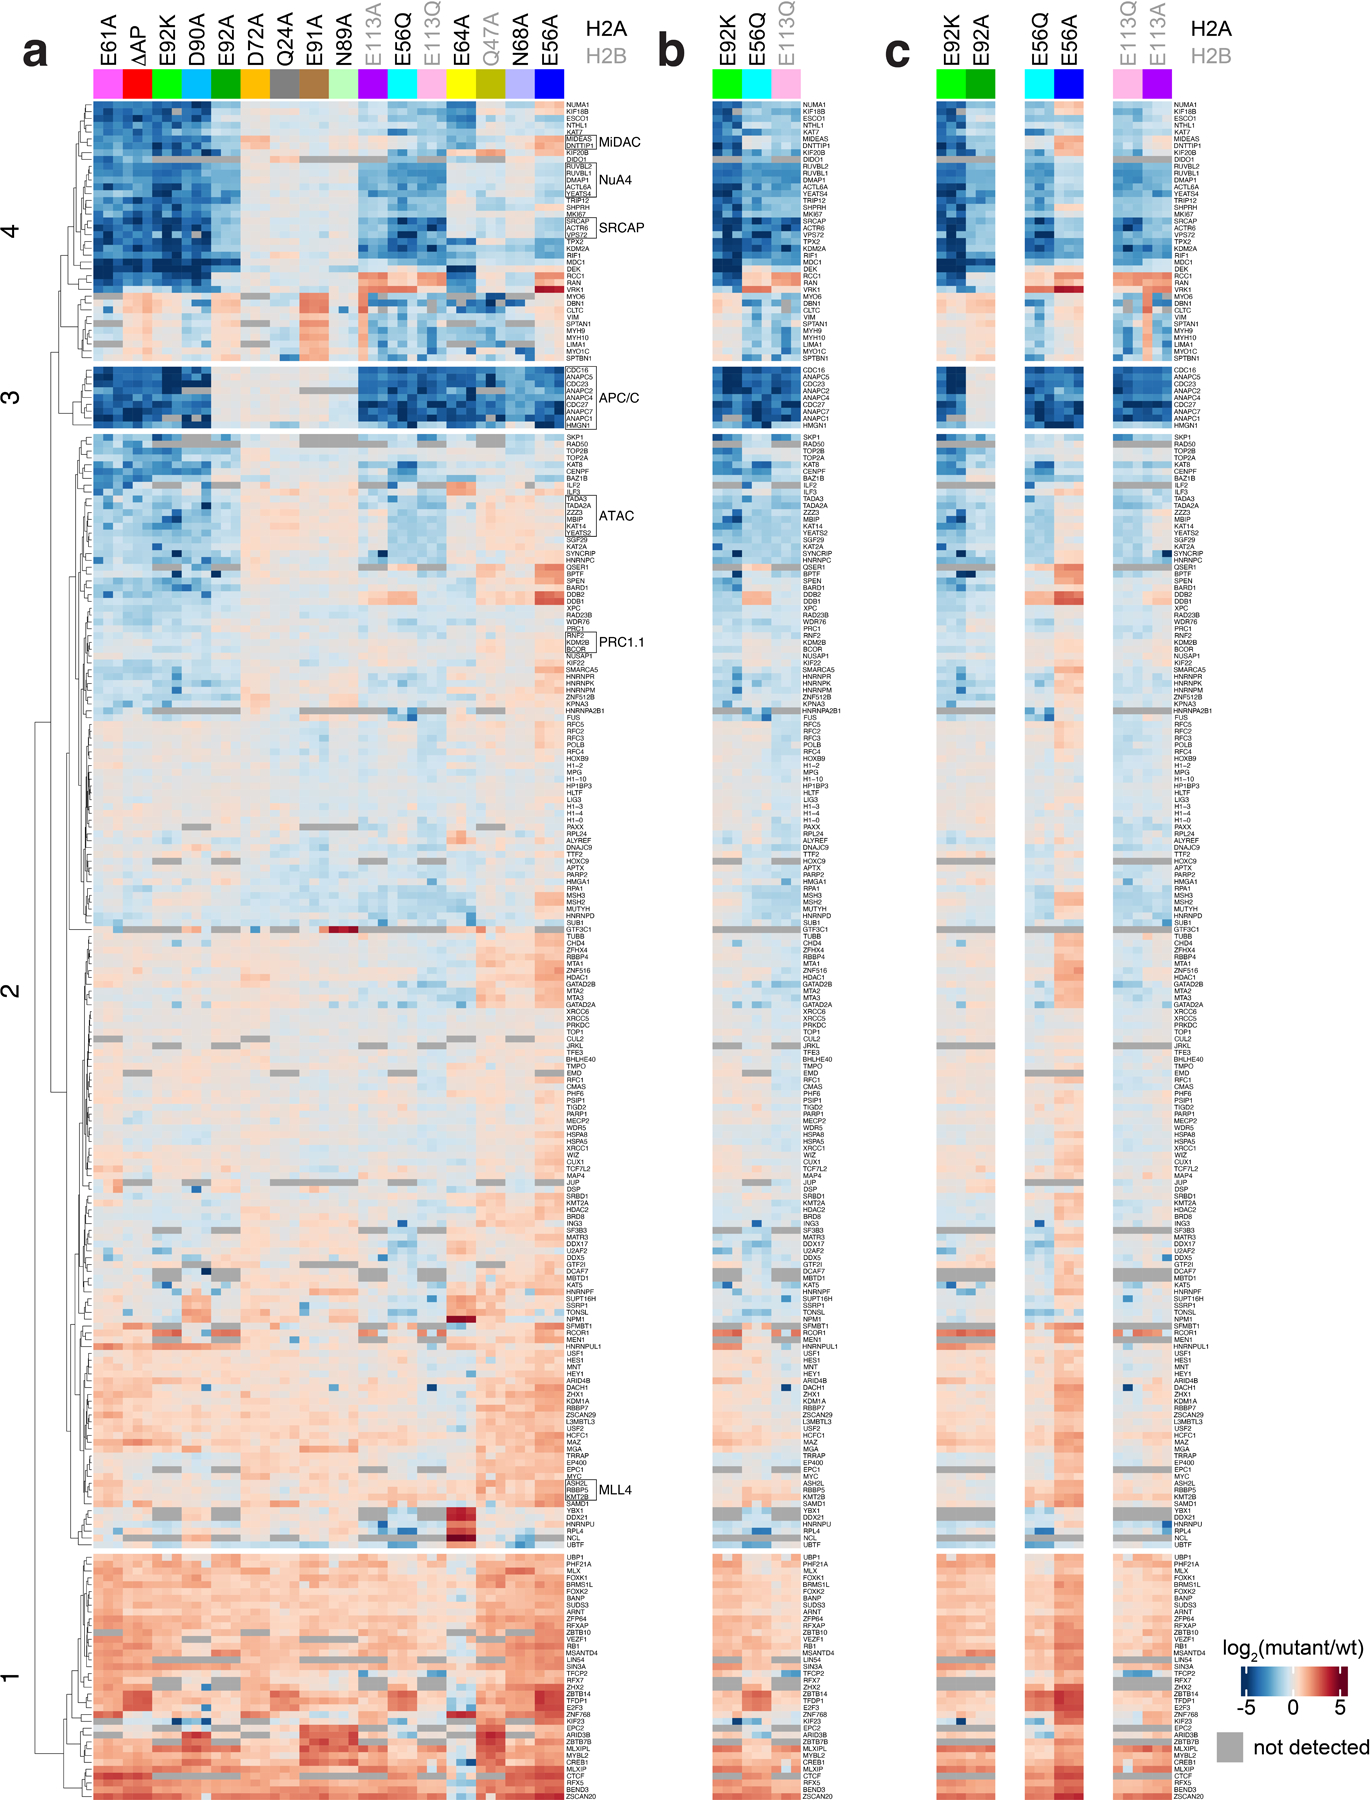
Extended Data Fig. 2 |. Oncohistone mutations have distinct effects on nucleosome binding.

Full heat map showing log2-fold change relative to wild-type nucleosome of quantified proteins listed at right across screen, clustered by protein and nucleosome mutant. b, Heat map of oncohistone mutant nucleosomes, clustered as in panel a. c, Heat map of each oncohistone mutation relative to the corresponding alanine mutation, clustered as in panel a.
