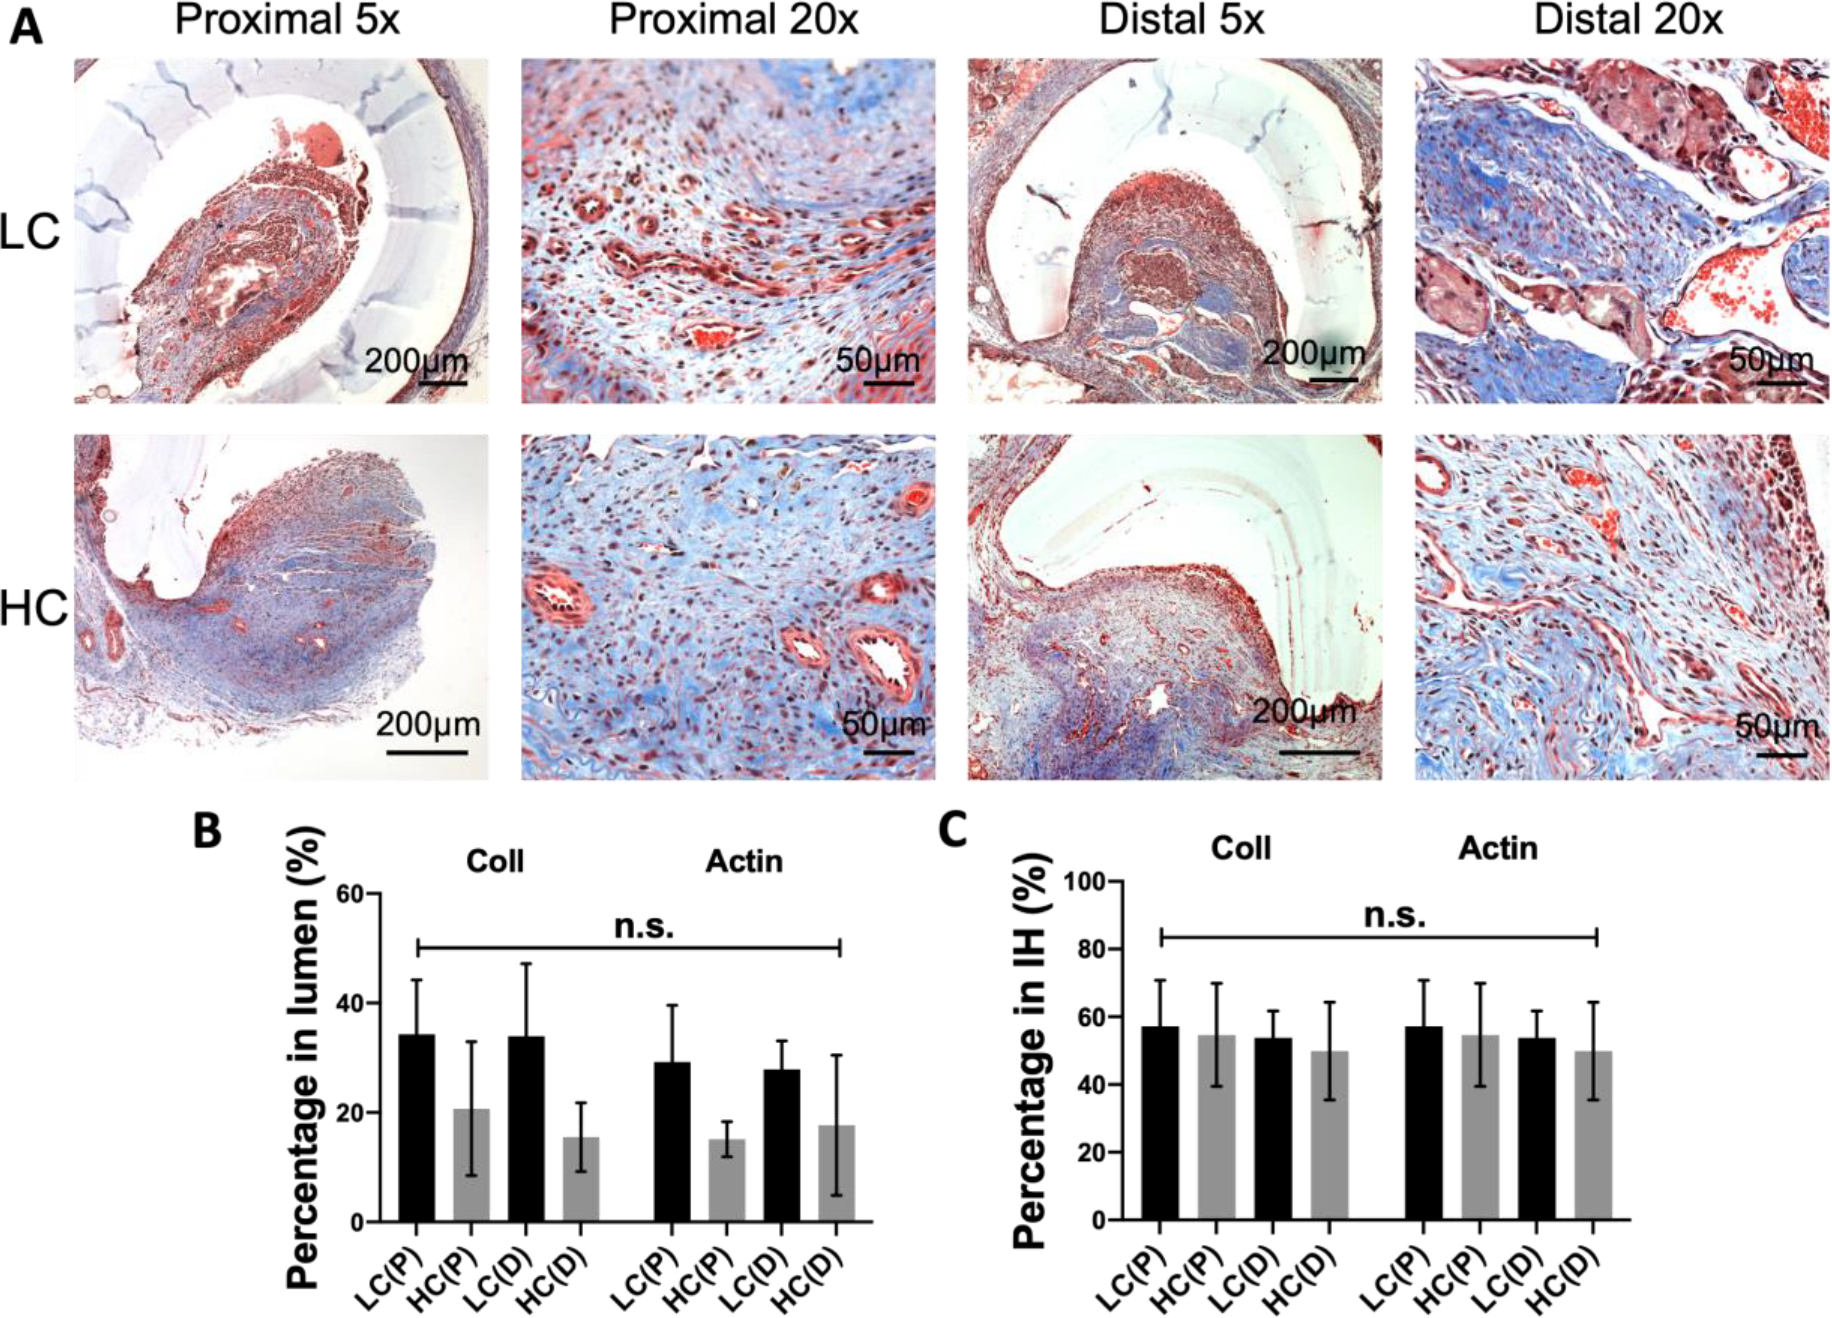
Figure 6.

Composition of intimal hyperplasia formed at the anastomoses of grafts with different compliance. (A) Representative Masson’s trichrome staining images of the stenosis in proximal and distal anastomose. (B) Percentage of collagen and muscle fiber area in the lumen of the grafts. (C) Percentage of collagen and muscle fiber area in the stenosis. n=5 for LC grafts, and n=4 for HC grafts. N.S. indicates no significant difference.
