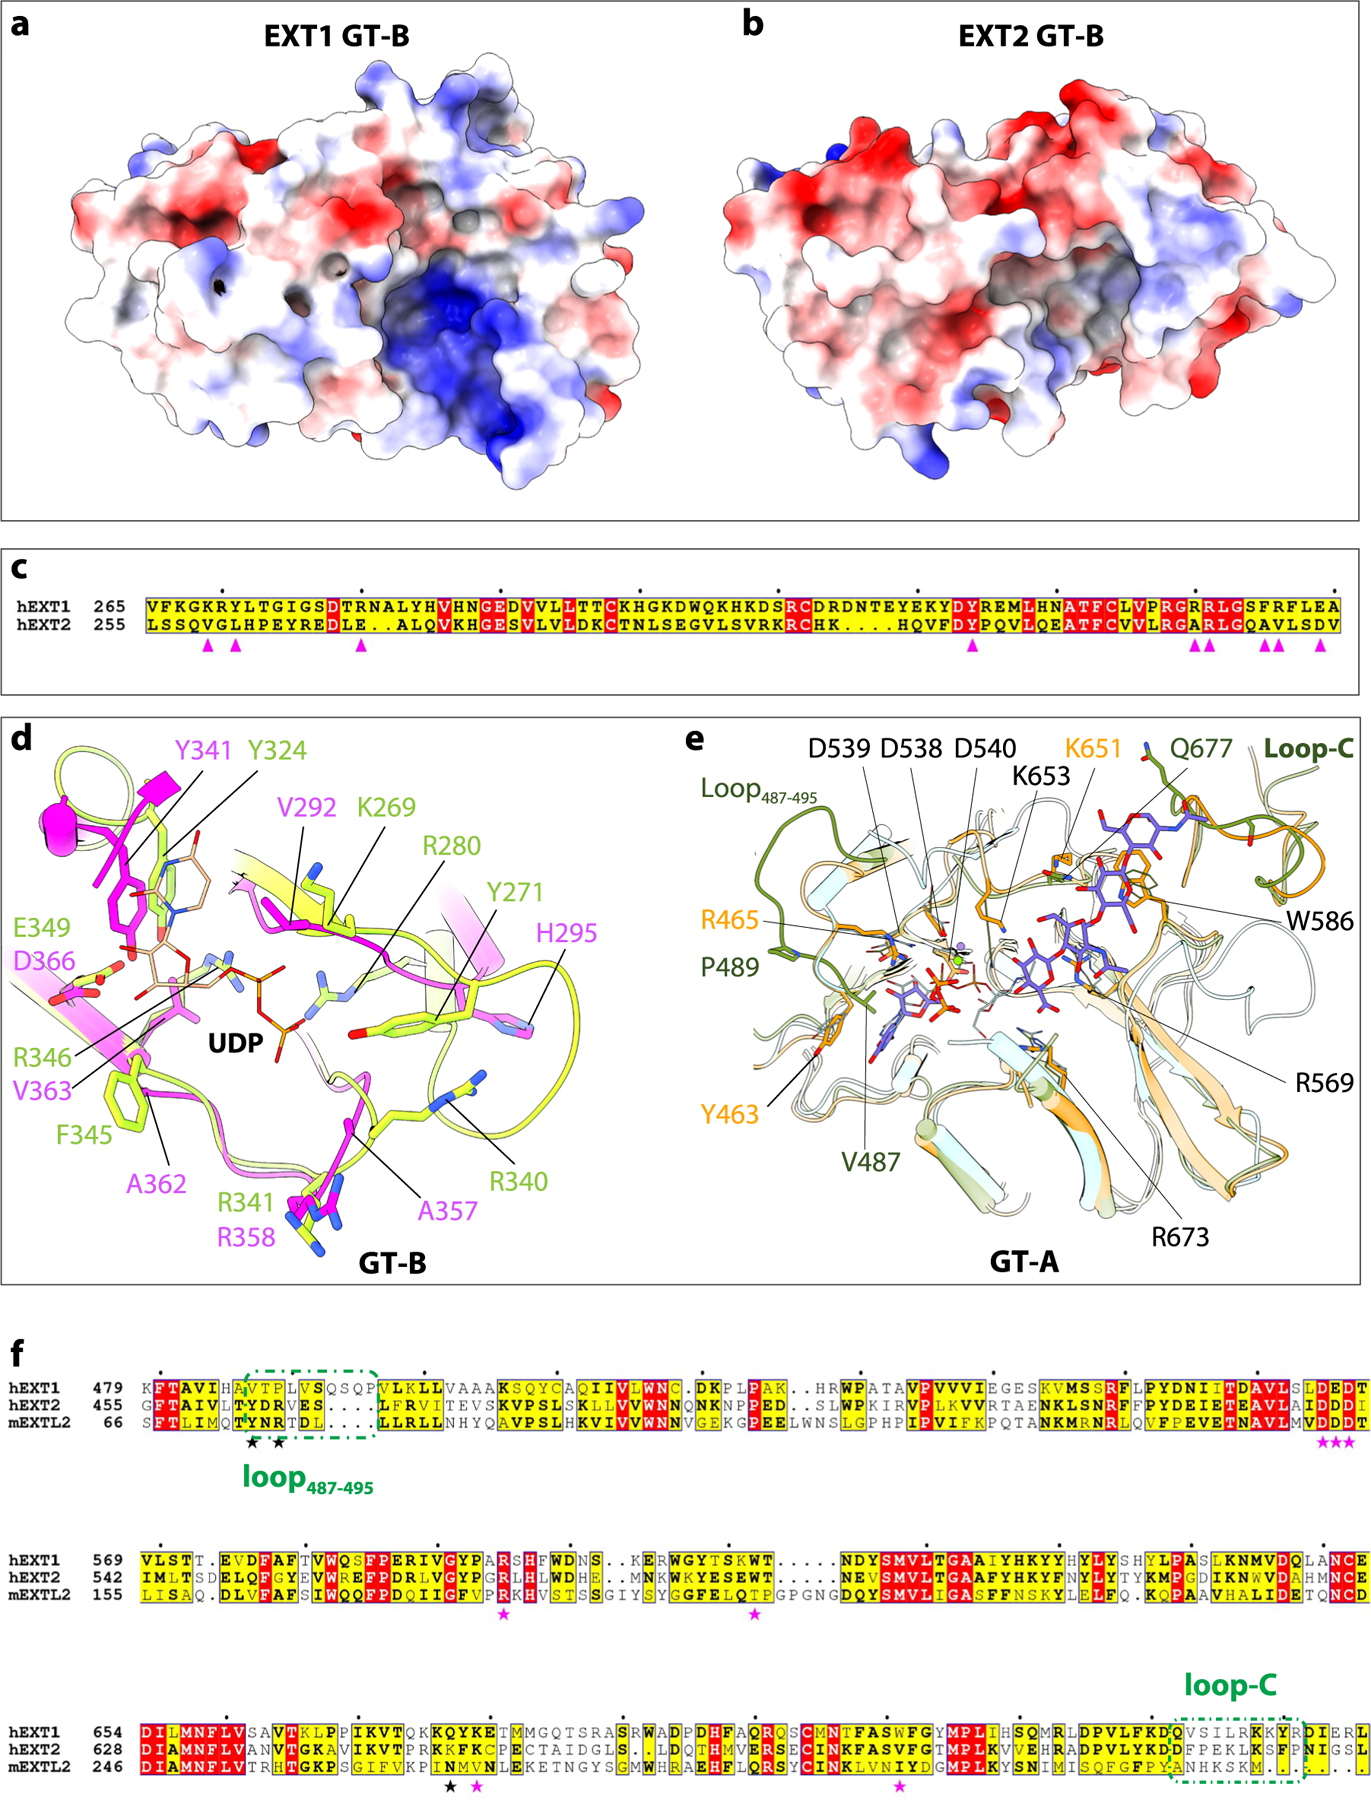
Extended Data Fig. 9 |. Comparison of the catalytic pockets of GT-A domains and GT-B domains explain why some of these domains are inactive.

a, b, Electrostatic potential of GT-B cleft in EXT1 and EXT2. Positive charged surface colored in blue, and negative charged surface in red. Superimposition of GT-B fold of EXT1 and EXT2. c, d, Sequence alignment and close-up view of UDP binding pocket of EXT1 and EXT2 GT-B. The key residues are marked and shown in sticks. e, Superimposition of active pocket in hEXT1 GT-A, hEXT2 GT-A, and mEXTL2 (PDB ID: 1ON6). The residues involved in substrate interaction shown in stick, and residues in hEXT2 are labeled, except for V487, P489, and K684 those not conserved in hEXT1. hEXT1 and hEXT2 colored the same as in Fig. 1, mEXTL2 colored in cyan. f, Sequence alignment of hEXT1, hEXT2, and mEXTL2. The residues involved in substrate interaction marked in star, the same one in hEXT1 and hEXT2 in magenta, while different one in black. The first (loop487–495) and last (loop-C) loop are marked in olive dashed frame.
