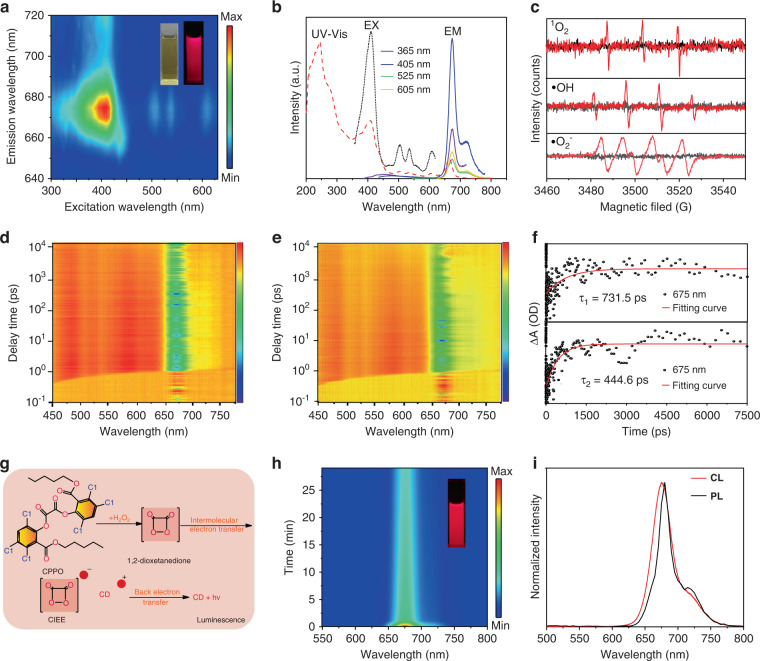
Fig. 2. The photophysical properties of the CDs.
a The excitation-emission matrix of the CDs ethanol solution (insets: the photograph of the CDs solution under sunlight and 365 nm UV lamp). b The UV–vis absorption spectra, PL excitation (EX) and emission (EM) spectra of the CDs ethanol solution. c The ESR spectrum upon light irradiation of the CDs for detecting the ROS species of 1O2, •OH and •O2− (Red line: Light conditions, Black line: Dark conditions). 3D pseudo-color map (in bird’s eye) of transient absorption (TA) spectra of CDs (d) and CDs mixed with bacteria (e) and their corresponding fitting curves (f). g Schematic illustration of the CL process induced by the CIEEL. h The time-dependent CL spectra after adding the CDs into the mixture of CPPO and H2O2 (inset: the photograph of the CL solution). i The normalized CL and PL emission spectra of the CDs

