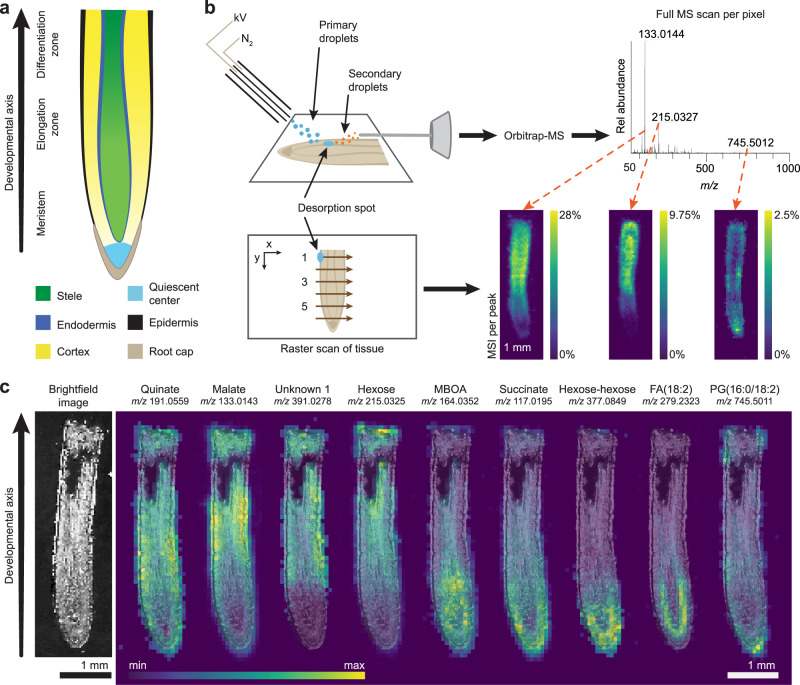
Fig. 1. DESI-MSI captures the distinct distribution patterns of endogenous molecules within the developing maize root.
a Maize root tip with developmental zones and tissue types. b Schematic of DESI-MSI shows the mechanism of ambient desorption and ionization by continuous spray of charged droplets, where one full scan is captured per pixel. The desorption spot is moved in a raster scan across the tissue to produce a pixelated map. Each peak in the full spectrum corresponds to one MS image. c Brightfield image of a maize root section prior to DESI imaging. DESI-MS images show that certain metabolites and lipids are most intense in distinct tissues and developmental zones. MS images are in the negative ionization mode and are overlaid with the brightfield image. The maximum intensity of each ion as a percentage of total ion current is: quinate, 1.40%; malate, 21.8%; unknown 1, 1.13%; hexose, 12.3%; 6-methoxy-2-benzoxazolinone (MBOA), 2.74%; succinate, 5.07%; hexose-hexose, 1.47%; fatty acid (18:2), 3.83%; and phosphatidylglycerol (16:0/18:2), 2.61%. This experiment was replicated ten times across three biological samples (Supplementary Table 1). Data from one representative tissue section are shown here. MS images of all ten sections are available in Supplementary Figs. 11–17, 23, 25.

