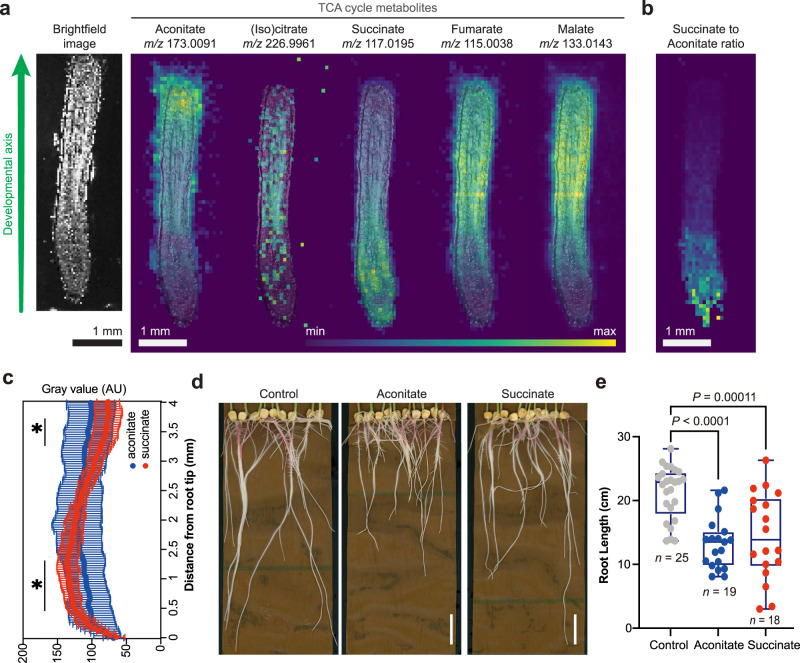
Fig. 2. The TCA cycle metabolites are differentially distributed along the developmental axis of the maize root.
a DESI-MS images of the detectable TCA cycle metabolites overlaid with a brightfield image captured prior to MS imaging. The maximum ion intensity as % TIC is different for each ion and is: aconitate, 2.99%; citrate/isocitrate, 0.271%; succinate, 3.12%; fumarate, 4.55%; and malate, 28.0%. b MS image of the intensity ratio of succinate to aconitate per pixel. Maximum of ratio scale is 11 (yellow). Imaging experiments were replicated ten times across three biological samples (Supplementary Table 1). Data from one representative tissue section are shown here. MS images of all ten sections are available in Supplementary Figs. 21–30. c Normalized intensity of aconitate and succinate along the root axis. The data are presented as means ± s.d. (n = 10 root sections across three biological replicates, Supplementary Table 1). Asterisks indicate statistical significance by two-tailed unpaired Student’s t-test (*P < 0.05, detailed P-values for each point can be seen in the Source Data file). All MS data were acquired in the negative ionization mode. d, e Maize root phenotypes under 10 mM aconitate and succinate treatment, respectively. Scale bars, 3 cm. For the boxplots, each dot represents the datapoint of one biological replicate; the central line indicates the median; the bounds of the box show the 25th and 75th percentiles; and the whiskers indicate maximum and minimum values. All P-values were determined by one-way ANOVA (all n and P-values are indicated in the graphs). Source data are provided as a Source Data file.

