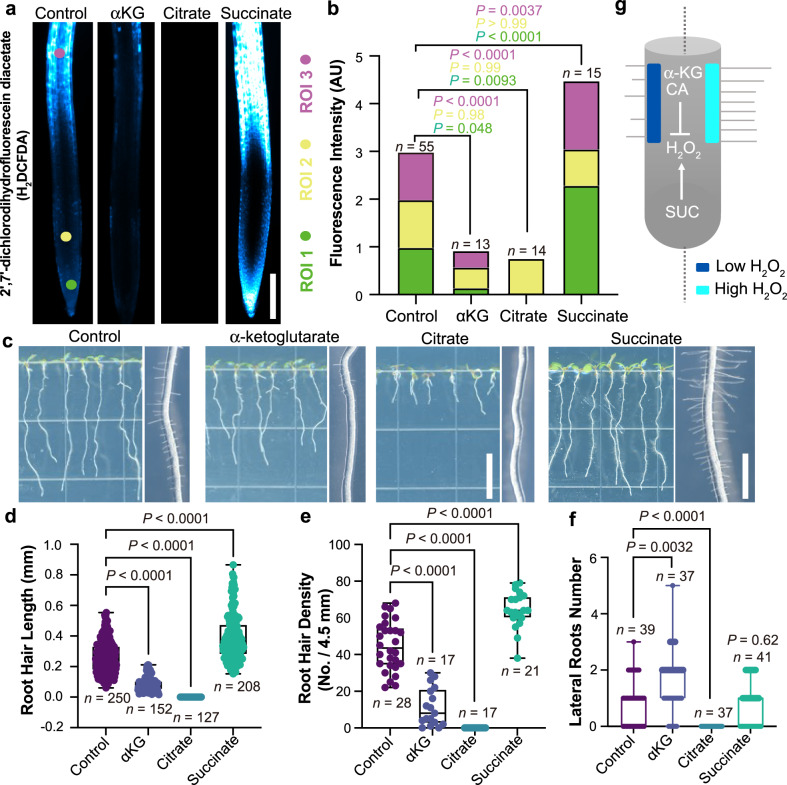
Fig. 4. TCA metabolites alter ROS levels and root hair development in Arabidopsis.
a Images of H2DCFDA, a biological reporter for H2O2, in roots treated with 5 mM TCA metabolites. Scale bar, 200 μm. b Quantification of the H2DCFDA fluorescence intensity in three regions of interest (ROIs). Data represent means. All P-values were determined by one-way ANOVA. c Images of Arabidopsis roots treated with 5 mM TCA metabolites. Scale bar for primary root (left), 1 cm. Scale bar for root hair (right), 1 mm. d, e Quantification of the effects of 5 mM TCA metabolite treatments on root hair phenotypes. All P-values were determined by one-way ANOVA. For the boxplots, the central line indicates the median; the bounds of the box show the 25th and 75th percentiles; and the whiskers indicate maximum and minimum values. f Effect of TCA metabolites on lateral root number. All P-values were determined by two-tailed unpaired Student’s t-test. g A model for how succinate (SUC), citrate (CA), and α-ketoglutarate (αKG) influence root hair development through their effects on H2O2 levels. Source data are provided as a Source Data file.

