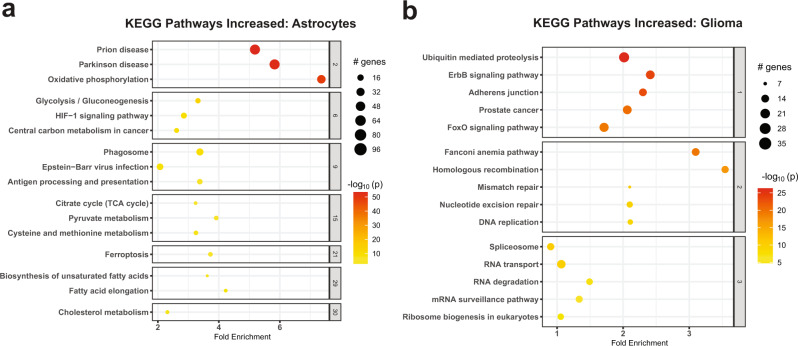
Fig. 3. Differentially expressed genes in astrocytes and glioma are enriched for different gene ontologies.
a, b Active subnetwork enrichment analysis of KEGG pathways in genes differentially expressed in CNVneg glioma-associated astrocytes compared to CNVpos glioma cells in primary and recurrent IDH-WT glioma. Fold-enrichment is represented on the x-axis and the pathways in the y-axis. The pathways are clustered to denote shared genes driving enrichment. Significance was calculated using a Fisher exact test. The size of the circle per pathway denotes the number of enriched genes, and the negative log10 of the Bonferroni adjusted p-value is represented by color. Pathways enriched in genes significantly higher in astrocytes compared to glioma cells are shown in a and include neurodegenerative diseases and oxidative phosphorylation, metabolism including fatty acid metabolism. Pathways enriched in genes significantly higher in glioma cells compared to astrocytes are shown in b and include DNA replication, splicing, and ErbB signaling.

