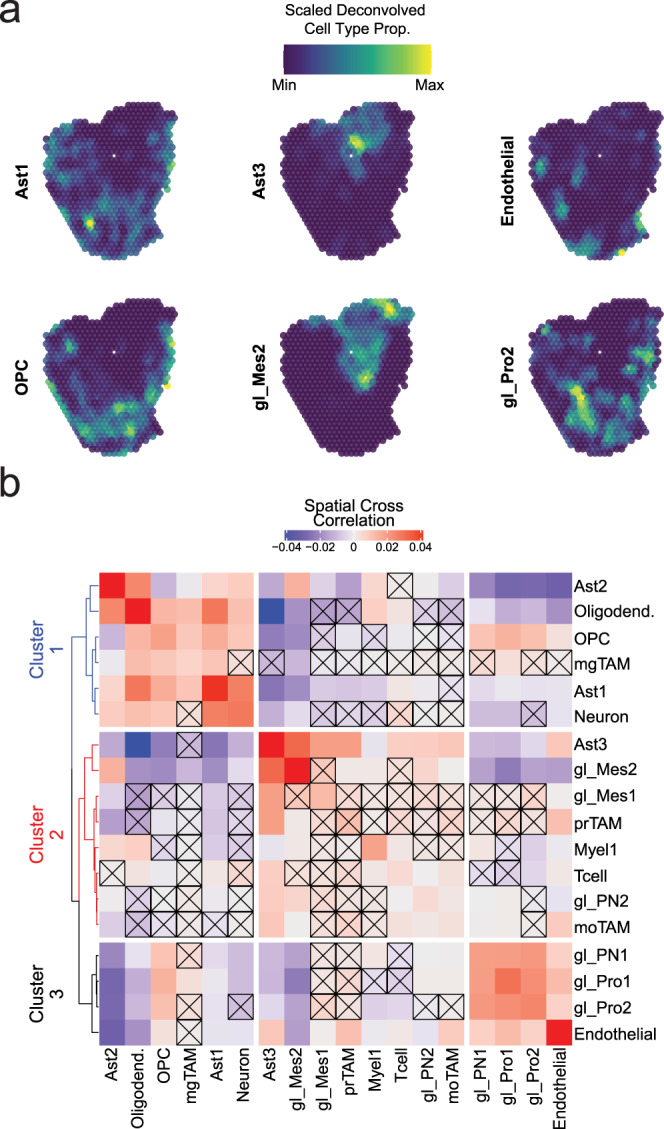
Fig. 5. Spatial transcriptomics identifies significant spatial relationships between cell types in GBM.

a Representative plots showing deconvolved proportions of select cell types and glioma states across an ST sample. Each subplot is range scaled for the proportion of that cell type in the sample to show the relative spatial distribution of that cell type. b Heatmap showing the average spatial cross-correlation between all cell types at a radius of 900 µm surrounding spatial transcriptomic spots across all nine ST experiments. The diagonal of the matrix, which shows the spatial cross-correlation between a cell type and itself, is an indication of the degree of spatial autocorrelation in that cell type and is not necessarily equal to one. Spatial cross-correlation relationships were tested for significance using permutation (see methods), and non-significant relationships are denoted with an X. Hierarchical clustering of the distance matrix derived from the cross-correlation matrix produced three clusters.
