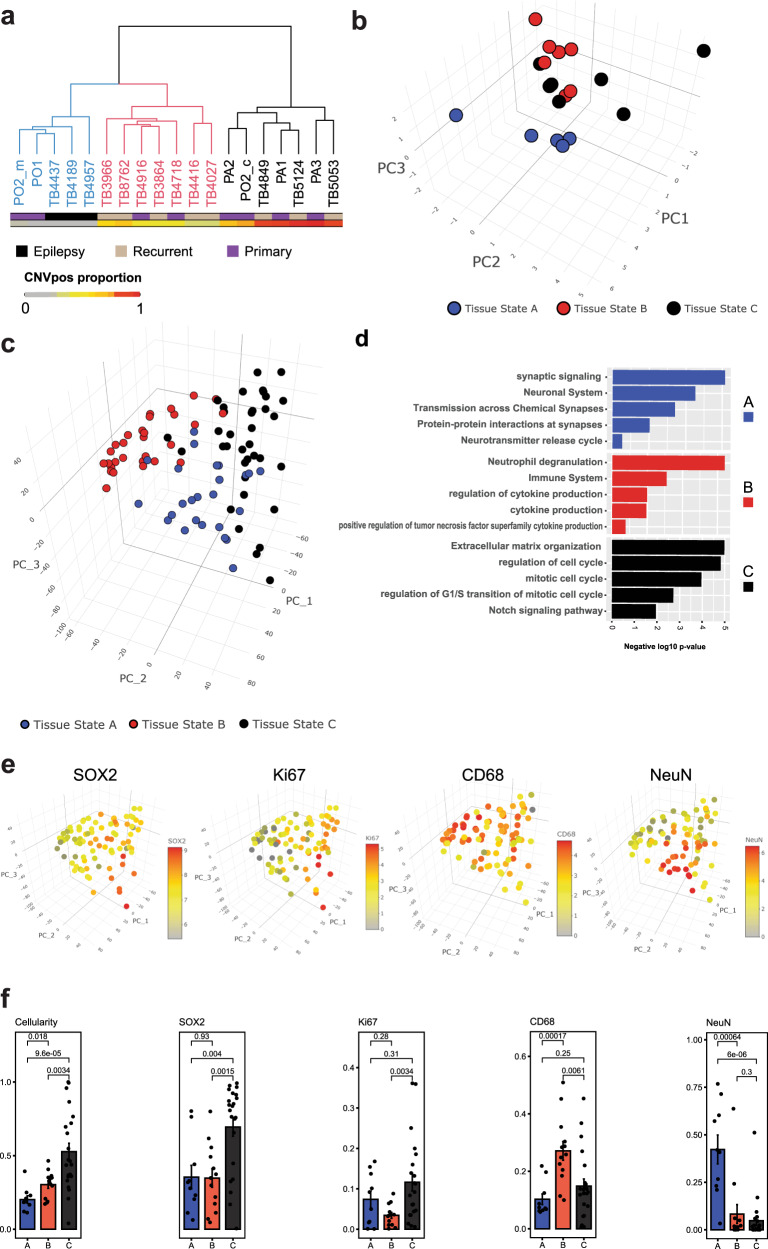
Fig. 6. Tissue composition analysis defines “tissue states” recapitulated in a validation bulk RNAseq dataset.
a Dendrogram of hierarchically clustered glioma and epilepsy samples based on Manhattan sample distance analysis drawn from the fractional composition matrix (see Fig. 4a). Three clusters were identified and are color-coded on the dendrogram in black (Tissue-state C), red (Tissue-state B), and blue (Tissue-state A). The condition (primary, recurrent and epilepsy) and proportion of neoplastic nuclei are indicated. b Three-dimensional scatter plot showing the samples in panel a projected in the first three principal component loadings—see Fig. 4b for PCA analysis. c Bulk RNAseq samples from 91 primary and recurrent IDH-WT glioblastoma samples projected in the principal component space. The samples were clustered (Hierarchical clustering—Ward.D2 method) on the Euclidian distance of the enrichment scores of the genes unique to each tissue state signature into three clusters A–C. d Gene ontology term analysis of the differentially expressed genes for each cluster in panel c. KEGG, REACTOME, or Biological Process GO pathways are shown in the y-axis. Negative log10 adjusted p-value is shown on the x-axis. e Normalized expression of select genes characteristic of each of the clusters projected onto the compositional-signature enrichment score space shown in panel c. Red denotes high expression, and gray denotes low expression. NeuN (RBFOX3) is highest in the samples of Cluster A. CD68 is highest in the samples of cluster B. SOX2 is highest in the samples of clusters B and C. MKI67 is highest in the samples of cluster C. f Quantification of histological cellularity analysis and immunohistochemistry labeling indices of SOX2, KI67, CD68, and NeuN. The labeling index is shown on the y-axis. Note that the y-axis for the cellularity graph is total cellularity normalized to the most cellular sample. The sample clusters are labeled (A–C) as in panel c. Indicated p-values were calculated using a Kruskal–Wallis test. n = 45 biological samples: 8 for cluster A, 25 for cluster B, and 12 for cluster C. Source Data are provided as a Source data file.

