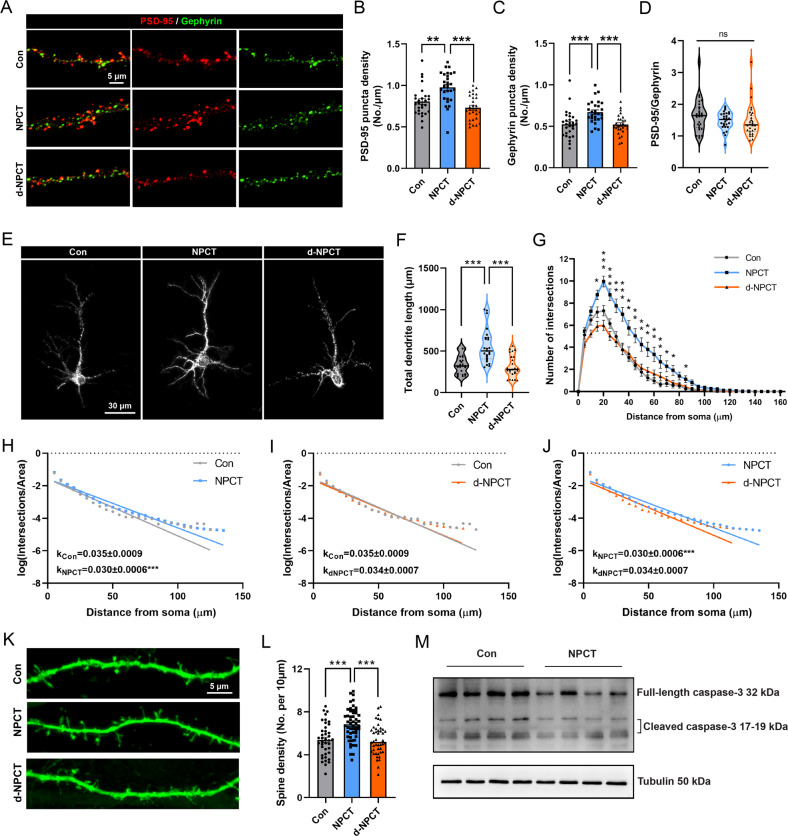
Fig. 4. NPCT has multiple neurotrophic effects on primary hippocampal neurons.
A Representative images showing the influences of incubation with 1 nM NPCT and d-NPCT for 24 h on the excitatory synaptic marker PSD-95 and inhibitory synaptic marker gephyrin in primary hippocampal neurons. B–D Quantifications of the density of PSD-95 puncta, gephyrin puncta, and the ratio of PSD-95/gephyrin. One-way ANOVA with Turkey’s post hoc analyses in (B, C) and Kruskal–Wallis H test in (D). n = 28 dendrites from 3 independent experiments in each group. **P < 0.01, ***P < 0.001. E Representative images demonstrating the neuritogenesis effects of 1 nM NPCT and d-NPCT incubation for 24 h in primary hippocampal neurons. F Statistical analysis showing the effects of NPCT on the total dendrite length. Kruskal–Wallis H test with Dunn’s post hoc analyses. n = 25 neurons from 3 independent experiments in each group. ***P < 0.001. G Linear sholl analysis showing that NPCT facilitated dendritic arborization in primary hippocampal neurons. Repeated-measure two-way ANOVA with Dunnett’s post hoc analyses. n = 25 neurons from 3 independent experiments in each group. *P < 0.05, **P < 0.01, ***P < 0.001, compared with control group. H–J Semi-log sholl analyses demonstrating that NPCT increased the complexity of dendritic arborization. A fitting line was generated by simple linear regression for each group and the k coefficient, calculated by multiplying negative one with the slope of the fitting line, was compared between groups. n = 25 neurons from 3 independent experiments in each group. ***P < 0.001, compared between groups. K Representative images showing the spinogenesis effects of NPCT in primary hippocampal neurons. L Statistical analysis demonstrating that NPCT increased the spine density. One-way ANOVA with Turkey’s post hoc analyses. n = 40 dendrites, 52 dendrites, and 44 dendrites from 3 independent experiments in the control, NPCT, and d-NPCT group, respectively. ***P < 0.001. M Immunoblots showing the effects of NPCT on the expression of full-length and cleaved caspase-3. n = 4 independent experiments. All data except (D, F) are presented as mean ± SEM. Data in (D, F) are presented as median with IQR.

