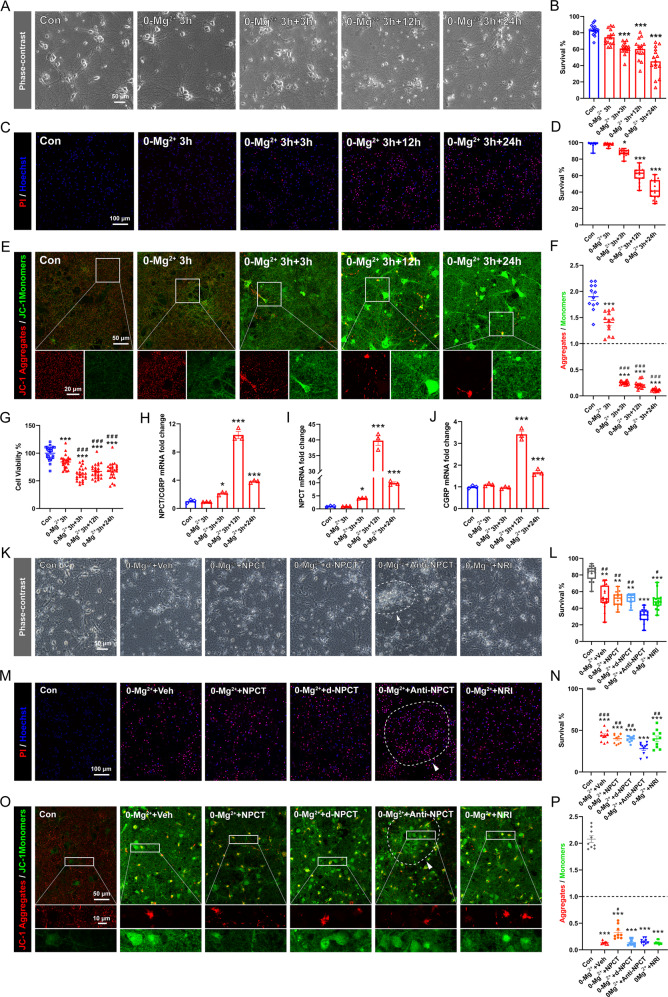
Fig. 5. Immunoneutralization of NPCT in the in vitro SE model increased neuronal death.
A, B Morphological analysis of neuronal death based on phase-contrast images captured at the end of 3 h 0-Mg2+ exposure (0-Mg2+ 3 h), 3 h after the end of 0-Mg2+ exposure (0-Mg2+ 3 h + 3 h), 12 h after the end of 0-Mg2+ exposure (0-Mg2+ 3 h + 12 h), and 24 h after the end of 0-Mg2+ exposure (0-Mg2+ 3 h + 24 h). Welch’s ANOVA with Dunnett’s T3 post-hoc analyses. n = 15 fields from 3 biological replicates. ***P < 0.001, compared with control group. C, D PI/Hoechst staining to investigate neuronal death at different time points as those in (A, B). Kruskal–Wallis H test with Dunn’s post hoc analyses. n = 15 fields from 3 biological replicates. *P < 0.05, ***P < 0.001, compared with control group. E, F JC-1 staining to detect MMP at different time points as those in (A, B). Welch’s ANOVA with Dunnett’s T3 post-hoc analyses. n = 12 fields from 3 biological replicates. ***P < 0.001, compared with control group; ###P < 0.001, compared with 0-Mg2+ 3 h group. G CCK-8 assays investigating neuronal viability at different time points as those in (A, B). One-way ANOVA with Turkey’s post hoc analyses. n = 24 wells from 3 independent experiments. ***P < 0.001, compared with control group; ###P < 0.001, compared with 0-Mg2+ 3 h group. H–J Relative mRNA fold change of the total mRNA of NPCT/CGRP, the exclusive NPCT mRNA, and the exclusive CGRP mRNA. One-way ANOVA with Dunnett’s post hoc analyses. n = 3 independent experiments. *P < 0.05, ***P < 0.001, compared with control group. K, L Morphological analysis of neuronal death based on phase-contrast images captured at 24 h after 3 h 0-Mg2+ exposure. Kruskal–Wallis H test with Dunn’s post hoc analyses. n = 15 fields from 3 biological replicates. ** P < 0.01, ***P < 0.001, compared with control group; #P < 0.05, ##P < 0.01, compared with 0-Mg2++Anti-NPCT group. M, N PI/Hoechst staining to investigate neuronal death after drug administration. Welch’s ANOVA with Dunnett’s T3 post-hoc analyses. n = 10 fields from 3 biological replicates. ***P < 0.001, compared with control group; ##P < 0.01, ###P < 0.001, compared with 0-Mg2++Anti-NPCT group. O, P JC-1 staining to detect MMP after drug administration. Welch’s ANOVA with Dunnett’s T3 post-hoc analyses. n = 9 fields from 3 biological replicates. ***P < 0.001, compared with control group; #P < 0.05, compared with any other group except the control group. Dotted line and arrowheads in (K, M, O) denote detached neurons mixed with piled up debris. All data except (D, L) are presented as mean ± SEM. Data in (D, L) are presented as median with IQR. MMP mitochondrial membrane potential, NRI nonimmune rabbit IgG.

