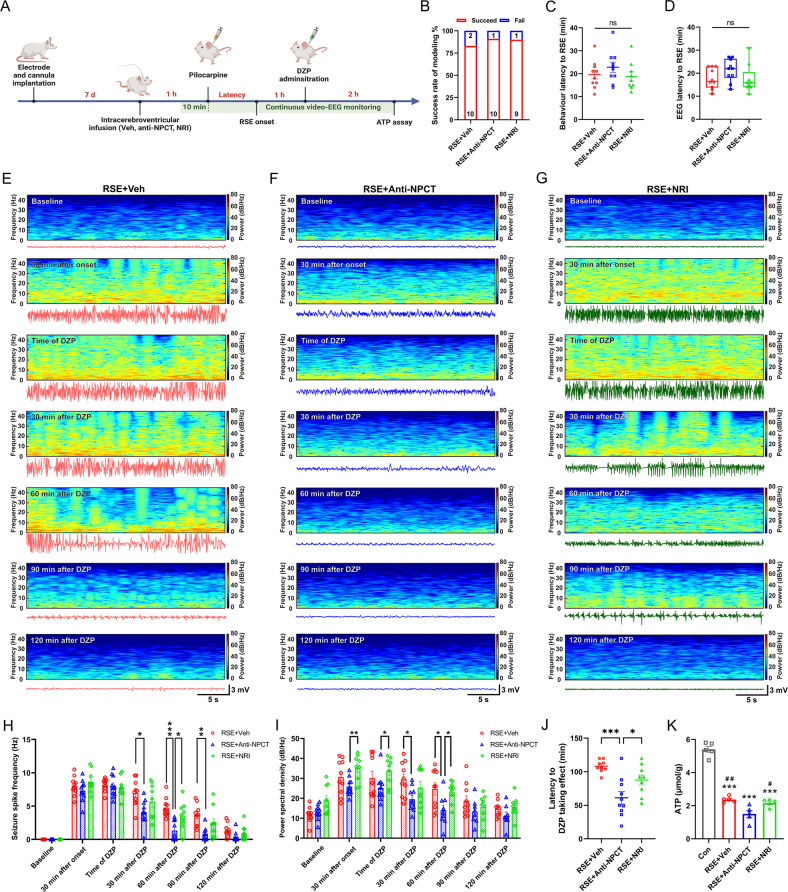
Fig. 7. Intracerebroventricular (i.c.v.) immunoneutralization of NPCT caused serious EEG power exhaustion and hippocampal ATP depletion in RSE.
A Schematic showing the procedure of i.c.v. NPCT immunoneutralization. B The success rate of modeling was similar among the three groups. Chi-square test. n = 10–12 rats in each group. C, D The behavior and EEG latencies to RSE onset were similar among the three groups. One-way ANOVA test in (C) and Kruskal–Wallis H test in (D). n = 9–10 rats in each group. E–G Representative hippocampal EEG power spectrums and corresponding EEG tracs in RSE animals receiving vehicle, anti-NPCT, and nonimmune rabbit IgG (NRI) in epochs of 30 s at different time points, i.e., baseline before pilocarpine, 30 min after onset, time of DZP administration, 30 min after DZP administration, 90 min after DZP administration, and 120 min after DZP administration. H The influences of i.c.v. immunoneutralization of NPCT on the seizure spike frequency and EEG spectral power (I) at different time points as those in (E). Mixed effects model with Turkey’s post hoc analyses. n = 9–10 rats in each group. *P < 0.05, **P < 0.01, ***P < 0.001, compared as graphed. J The latency to DZP taking effects in each group. One-way ANOVA with Turkey’s post hoc analyses. n = 9–10 rats in each group. *P < 0.05, ***P < 0.001. K Hippocampal ATP levels at the end of video-EEG monitoring. One-way ANOVA with Turkey’s post hoc analyses. n = 5 rats in each group. ***P < 0.001, compared with control group; #P < 0.05, ##P < 0.01, compared with RSE + Anti-NPCT group. All data except (B, D) are presented as mean ± SEM. Data in (B) are presented as percentages with the numbers in columns representing the animal number. Data in (D) are presented as median with IQR.

