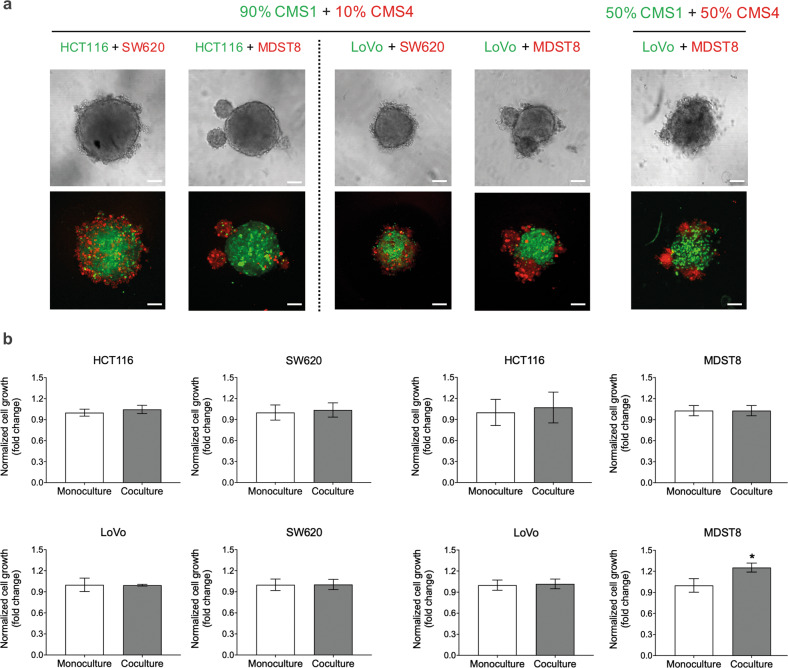
Fig. 1. CMS1 and CMS4 cells in cocultured 3D spheroids.
a Representative live cell confocal fluorescence microscopy images showing spheroid morphology and cell distribution on day 4 post-seeding. HCT116 cells were stained with cell tracker CMFDA (green), SW620 and MDST8 cells were stained with CMRA (red) fluorescent probes, LoVo cells express GFP. Scale bars = 100 μm. b Cell growth in cocultured 3D spheroids. Cell growth was measured in cocultured tumor spheroids by means of image analysis quantifying the fluorescence intensity of cell trackers that represent the cell number, and normalized to the monoculture as a control. The bars represent the average of cell growth and the error bars represent the standard deviation (n = 3). Statistical significance was calculated using a one-way ANOVA followed by Student’s t-test. P-values of <0.05 and 0.01 were considered significant (*) and highly significant (**), respectively.

