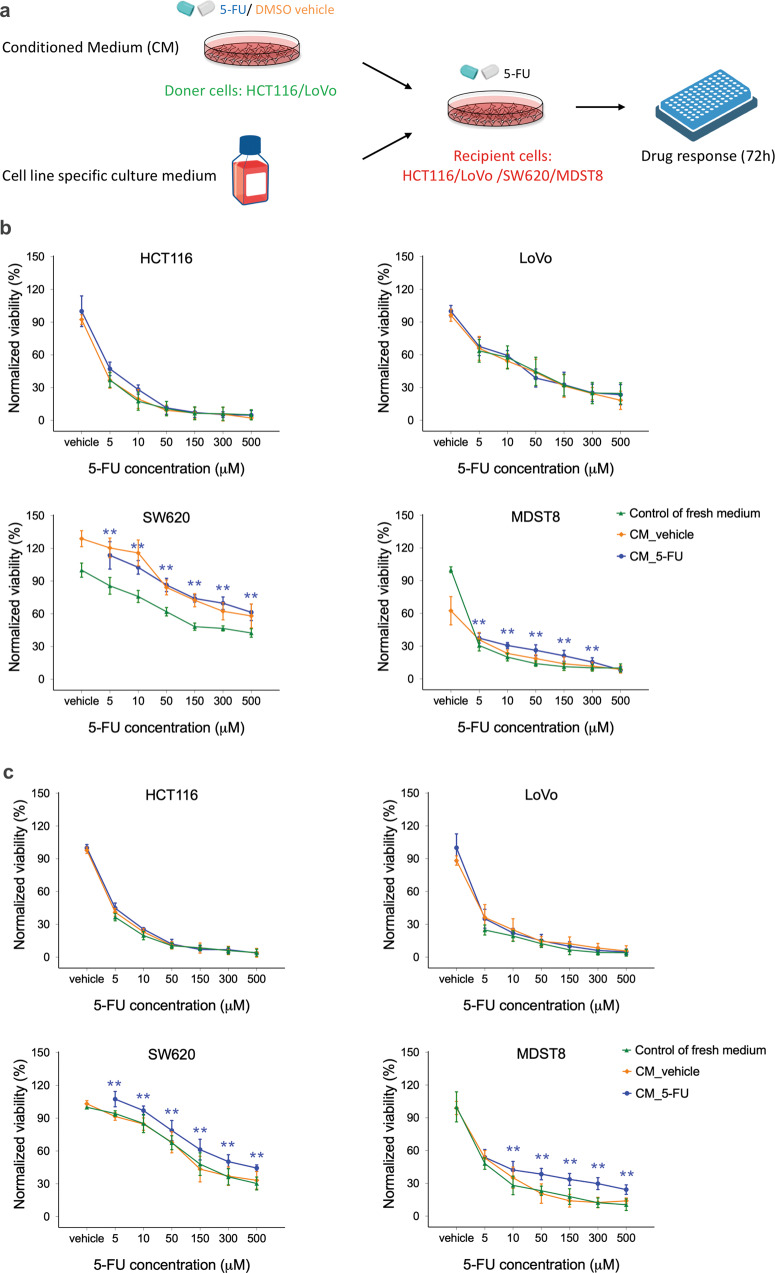
Fig. 3. Drug resistance effect of conditioned media (CM) of CMS1 cells.
a Schematic of recipient cells treated with CM of donor cells. Recipient cells were treated with either CM_vehicle or CM_5-FU of b HCT116 or c LoVo doner cells, and were exposed to different concentrations of 5-FU for 3 days. Cells treated with media only were taken as a control. Cell viability was measured using MTS assays. The squares, circles, and triangles represent the average viability normalized to the vehicle control and the error bars represent the standard deviation (n = 3). Statistical significance was calculated using a one-way ANOVA followed by Student’s t-test. P-values of <0.05 and 0.01 were considered significant (*) and highly significant (**), respectively, when compared to the control.

