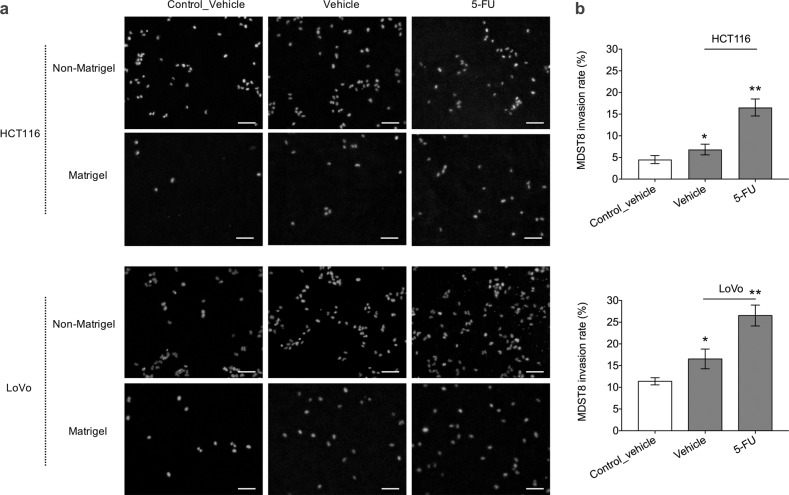
Fig. 4. MDST8 cell invasion through transwell membrane.
a Representative widefield fluorescence microscopy images showing MDST8 migration and invasion through transwell membrane with and without Matrigel coating after 2 day exposure to HCT116 or LoVo in the bottom wells. MDST8 exposed to only media without cells were taken as a control. Cells were treated with either DMSO vehicle or 2.5 μM of 5-FU. Cell nuclei were stained with Hoechst (blue). Scale bars = 100 μm. b Invasion rate of MDST8 presented as the percentage of cell invasion through Matrigel-coated transwell membrane relative to the cell migration through the non-Matrigel coated transwell membrane. The bars represent the average and the error bars represent the standard deviation (n = 3). Statistical significance was calculated using a one-way ANOVA followed by Student’s t-test. P-values of <0.05 and 0.01 considered significant (*) and highly significant (**), respectively, when compared to the control.

