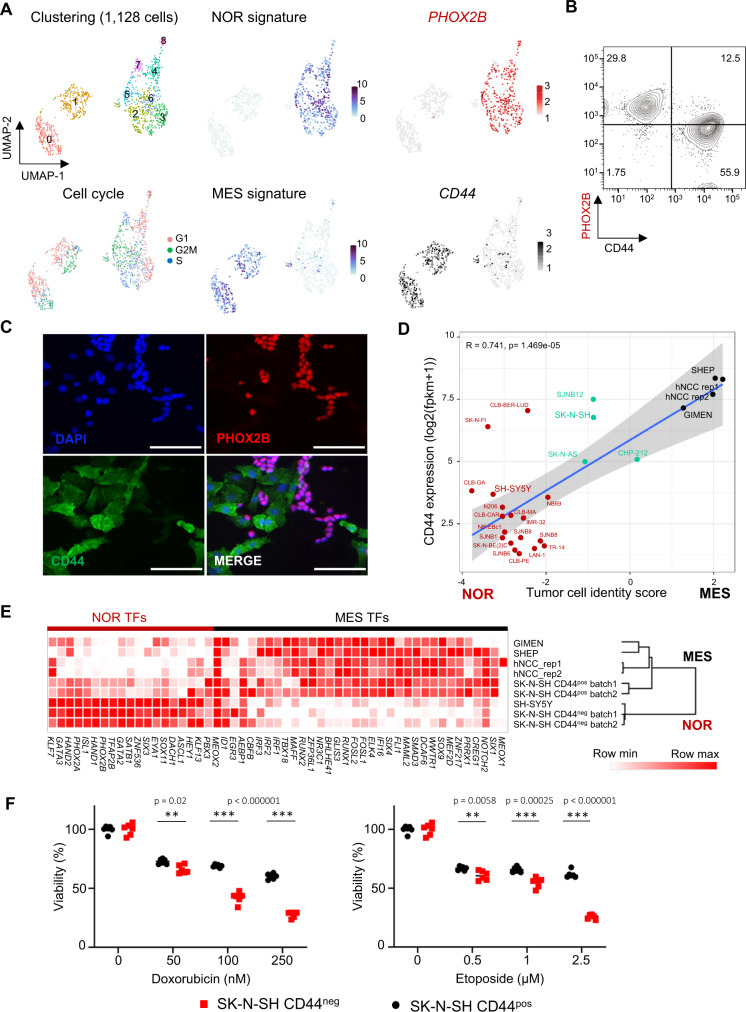
Fig. 1. The cell surface marker CD44 discriminates noradrenergic and mesenchymal tumor cells in the SK-N-SH cell line.
NOR noradrenergic, MES mesenchymal. A Single-cell RNA-seq analysis by Seurat of the SK-N-SH cell line (batch 1). The umap plot shows the clustering at resolution 0.8 and the cell cycle score. Two main cell identities are highlighted by noradrenergic and mesenchymal transcription factor signatures17,18 and PHOX2B and CD44 expression, respectively. Each cell identity includes cycling cells. B FACS analysis of the SK-N-SH cell line (batch 1) after cell permeabilization using PHOX2B and CD44 antibodies, gated in live cells after doublet exclusion. C Immunofluorescence analysis of the SK-N-SH cell line (batch 1) with the PHOX2B and CD44 markers (scale bar = 50 µm, representative of 3 independent experiments). D Scatterplot showing the correlation of CD44 expression by bulk RNAseq in each cell line with the tumor cell identity score (score MES - score NOR). Noradrenergic and mesenchymal scores correspond to the mean expression of transcription factors that define each identity. Simple linear regression line is shown, and gray cloud represents the 95% two-tailed confidence interval of the slope. The measure of linear association is given by Pearson’s product moment correlation production (r) with its associated p-value (t = 5.4123, df = 24, 95% CI for r [0.4966679, 0.8769103]). Color code: red = noradrenergic, black = mesenchymal, green = intermediate cell lines. E Unsupervised clustering of samples using the expression of noradrenergic and mesenchymal transcription factors (TFs)17,18 on bulk RNAseq data indicates that CD44neg and CD44pos sorted cells exhibit a transcriptomic profile close to the noradrenergic SH-SY5Y and mesenchymal SH-EP, GIMEN or hNCC cells, respectively. Two independent replicates of SK-N-SH (batches 1 and 2) have been analyzed. F Mesenchymal/CD44pos sorted cells are more resistant to doxorubicin and etoposide than noradrenergic/CD44neg cells. Cell viability was measured by resazurin assay after 72 h of chemotherapy treatments (Doxorubicin 50, 100, 250 nM and Etoposide 0.5, 1, 2.5 µM) (mean ± sd; n = 6 replicates). P-values were determined via two-tailed unpaired Welch’s t-test. Source data are provided as a Source Data file.

