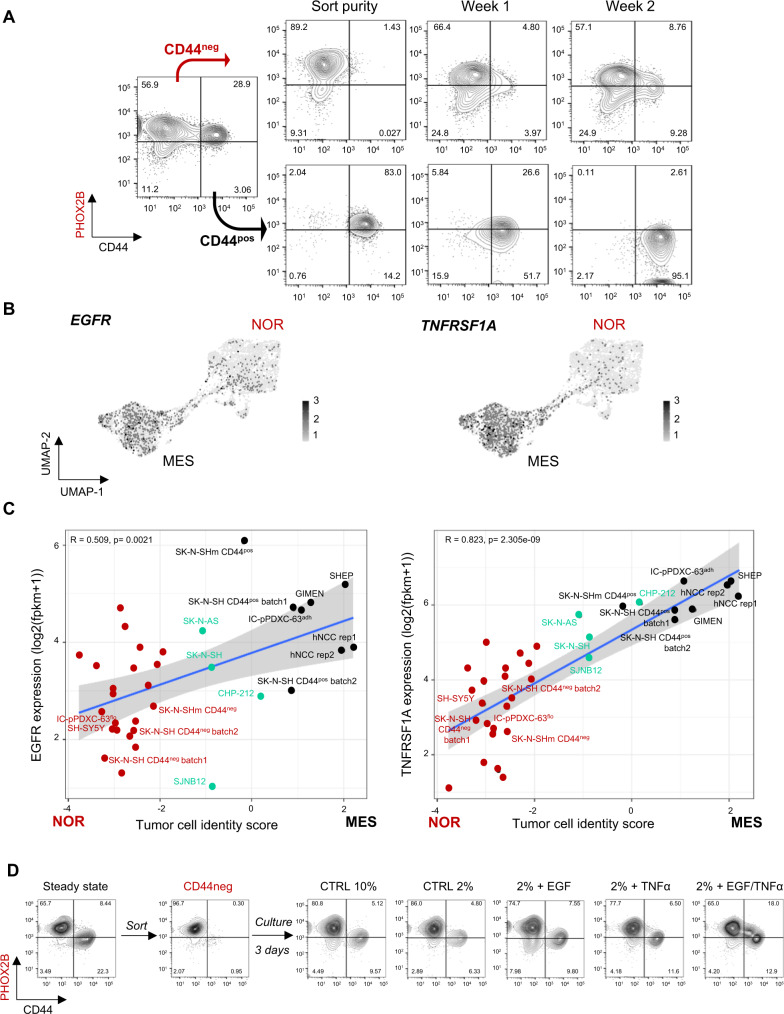
Fig. 3. Noradrenergic to mesenchymal plasticity can be induced by extrinsic factors including EGF and TNFα.
NOR noradrenergic, MES mesenchymal. A Noradrenergic to mesenchymal shift of identity of the IC-pPDXC-63 cell line. Mesenchymal/CD44pos and noradrenergic/CD44neg cells were FACS sorted and cultured for two weeks. Only the CD44neg sorted population reconstituted a heterogeneous cell population after several days in culture. Representative FACS analyses of PHOX2B and CD44 staining gated on live cells after doublet exclusion are shown. B Umap plot of EGFR and TNFRSF1A gene expression in scRNAseq of IC-pPDXC-63. C Scatterplot showing the correlation of EGFR and TNFRSF1A gene expression by RNAseq in each cell line with the tumor cell identity score (score MES - score NOR). Noradrenergic and mesenchymal scores correspond to the mean expression of transcription factors that define each identity17,18. Simple linear regression line is shown, and gray cloud represents the 95% two-tailed confidence interval of the slope. The measure of linear association is given by Pearson’s product moment correlation production (r) with its p-value (TNFRSF1A: t = 8.1978, df = 32, 95% CI for r [0.6719094, 0.9083932]; EGFR: t = 3.3464, df = 32, 95% CI for r [0.2065378, 0.7228518]). Color code: red = noradrenergic, black = mesenchymal, green = intermediate cell lines. Source data are provided as a Source Data file. D Representative FACS analysis using PHOX2B and CD44 marker expression gated on live cells after doublet exclusion to follow the noradrenergic to mesenchymal shift of identity of the SK-N-SHm cell line. CD44neg cells were culture in control conditions (CTRL, 2% FBS) or with EGF and TNFα growth factors (20 nM each) for 48 h.

